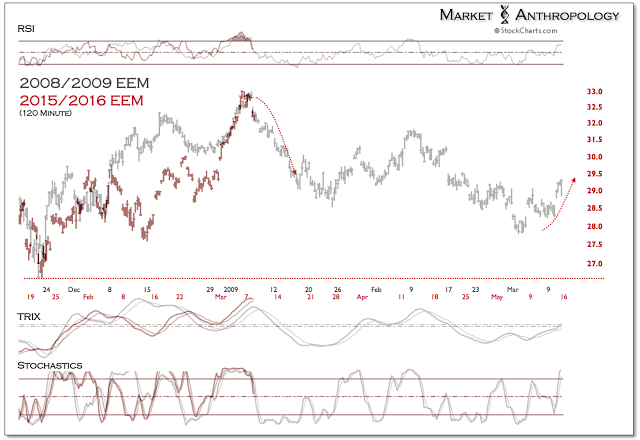
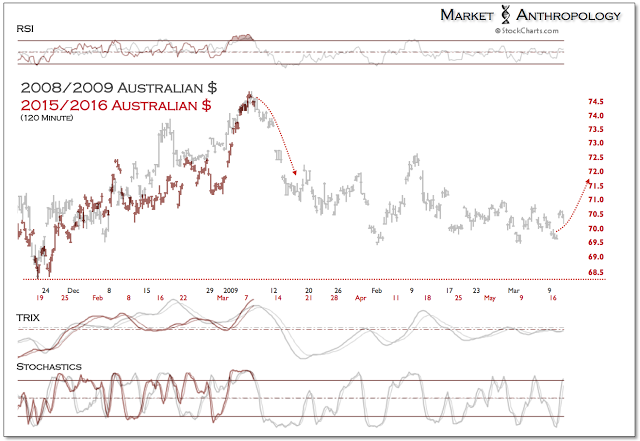
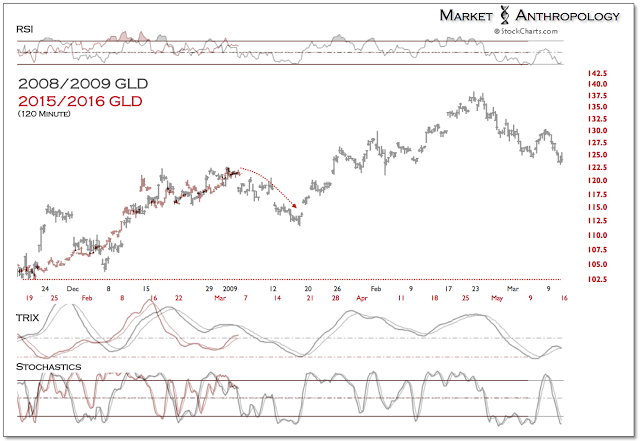
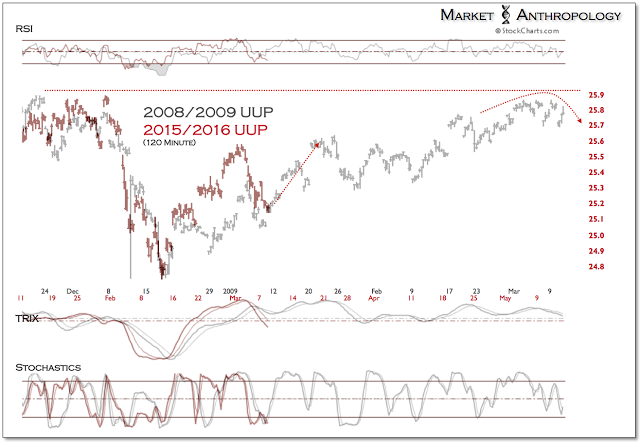
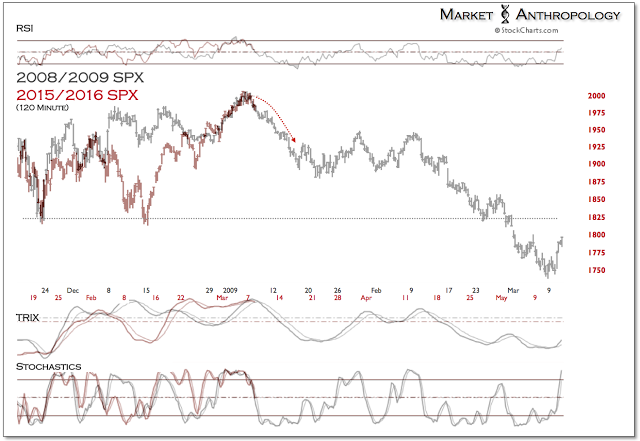
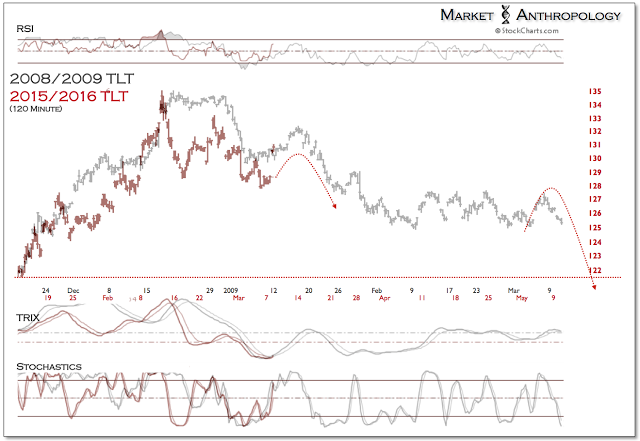
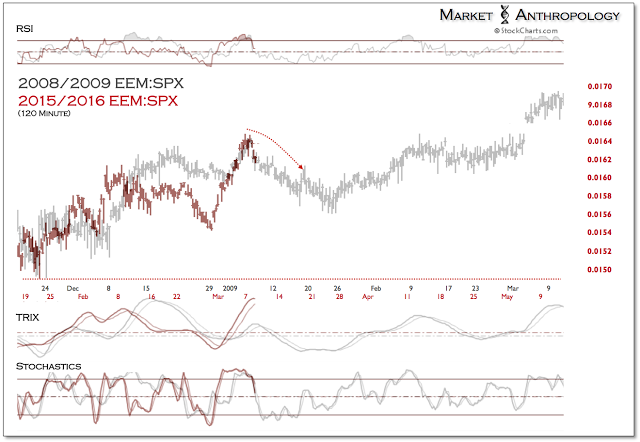
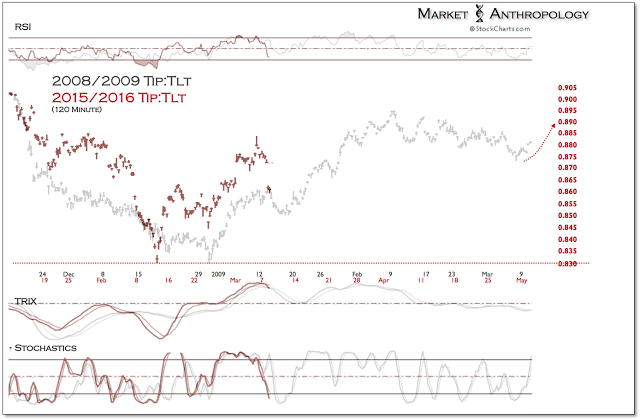
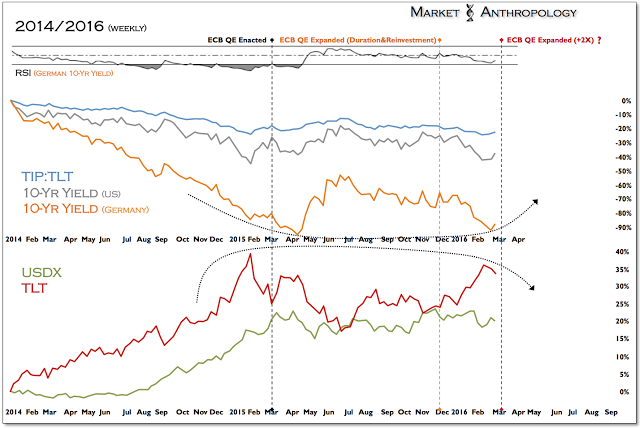
With another much-anticipated ECB meeting on deck for Thursday and with reflationary asset trends appearing at a prospective retracement pivot, I thought I would share an alternative comparative that would have the US dollar making another push up after the ECB’s March meeting, to test the highs from late January.
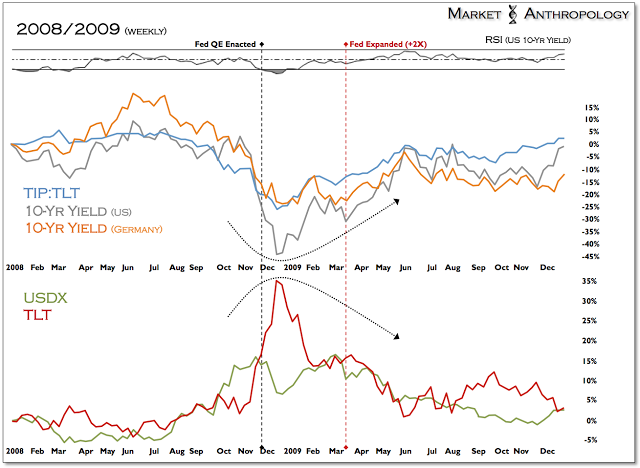
This series was fit to the final retracement rally that began in Q4 2008; before the markets in January 2009 began their last leg lower to their respective March 2009 lows. Generally speaking, the comparison has similarities to the leading reflationary moves today in precious metals, emerging markets, commodity currencies and yields - that led the broader market in early 2009 and which had secondary lows that March above their momentum lows from November 2008. All things considered - and if the dollar makes another move and is rejected by the January highs - I suspect this will be the case again as inflation expectations turn higher.
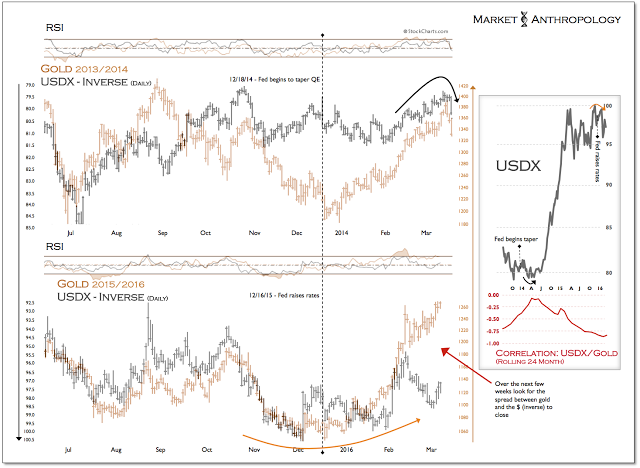
Granted, in Q1 2014 a similar set-up developed as gold and emerging markets (via the iShares MSCI Emerging Markets Fund (NYSE:EEM)) outperformed and as the dollar appeared poised to test the bottom of its long-term range. Ultimately, the reflationary move exhausted as the dollar became supported by expectations that the Fed was progressing towards a relatively tighter monetary policy regime.
With the US dollar surging over the past two years, as the Fed crawled towards a prospective rate hike off ZIRP, the expectation phase supported a historically large window for participants to build long dollar and disinflationary positions in. My general point of view has been that these positions – like the Fed’s dot plots - were placed with over-ambitious expectations. To a large degree the market effects this time around have been the inverse to the rampant belief in 2011 that the dollar was headed substantially lower and that the Fed was complicit in falling behind inflation expectations.
Overall, if Draghi succeeds on Thursday with delivering a policy response from the ECB that meets or exceeds expectations, the immediate reflex in the markets would likely be counter towards the broad base in the euro and inflation expectations that have developed over the last year as the ECB has moved towards more aggressive policy measures. Although it runs counter towards the prevailing desire that a weaker euro is Europe's best bet, I still believe that a broadly weaker US dollar would have the greatest efficacy in the long-term towards European economies, as it would reflexively affect inflation expectations worldwide – most notably in emerging markets that the IMF estimates will account for more than 70 percent of global growth through the end of this decade.
Assuming the markets loosely follow the pivots of the 2009 comparative, the following macro takeaways would be:
- The retracement rally in equities is over.
- Emerging markets and commodity currencies - such as the Australian dollar, will underperform over the next month, but make secondary lows above their respective January lows.
- Developed markets - such as the US, will break their January lows.
- The US dollar will make an attempt at testing the January highs, before beginning its next leg lower.
- Gold will retrace lower over the coming weeks, closing the inverse correlation gap with the dollar. This model would suggest an estimated target of around 1150 for gold.
- Treasuries (via iShares 20+ Year Treasury Bond (NYSE:TLT)) will initially rally over the next week as the equity markets turn down, but resume their sell-off as inflation expectations improve.
Food for thought and best of luck.
