How many of the elderly live totally on social security benefits live better and better every year? It seems that social security is designed as a declining real benefit program. Yet the CBO in Testimony on using the Chained CPI to index Social Security stated:
The purpose of indexing Social Security and other federal benefits for inflation is to prevent the purchasing power of those benefits from eroding over time as prices rise. Similarly, the purpose of indexing parameters of the tax code is to tax similar amounts of real (inflation-adjusted) income at roughly the same rates over time.
[...] Although many analysts consider the chained CPI to be a more accurate measure of the cost of living than the traditional CPI, using it for indexing could have disadvantages. The values of the chained CPI are revised over a period of several years, so affected programs and the tax code would have to be indexed to a preliminary estimate of the chained CPI that is subject to estimation error. Also, the chained CPI may understate growth in the cost of living for some groups. For instance, some evidence indicates that the cost of living grows at a faster rate for the elderly than for younger people, in part because changes in health care prices play a disproportionate role in older people’s cost of living. However, determining the impact of rising health care prices on the cost of someone’s standard of living is problematic because it is difficult to measure the prices that individuals actually pay and to accurately account for changes in the quality of health care.
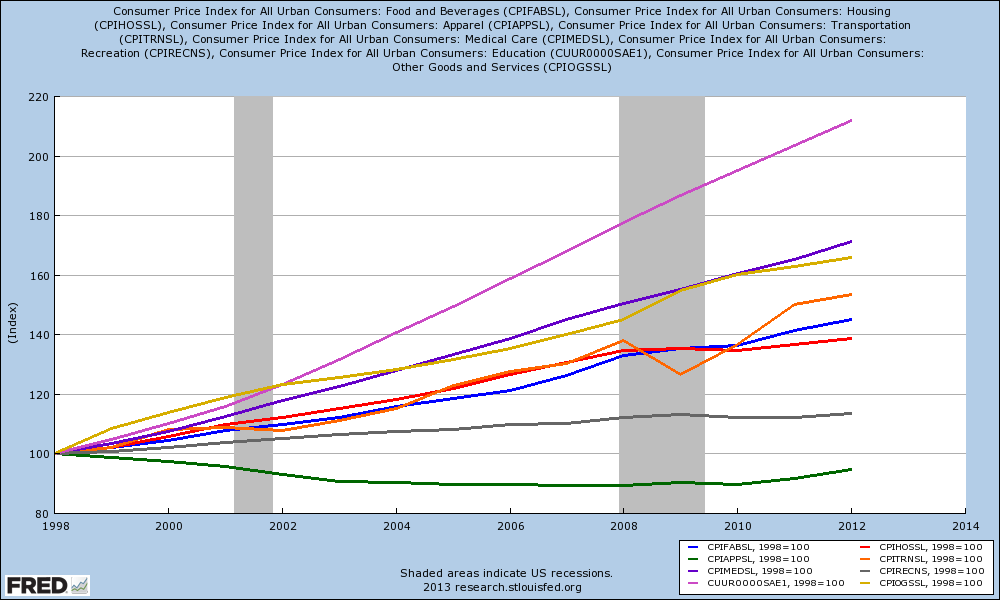
The bold sentence in the above paragraph is can be confirmed by looking at the components of the Consumer Price Index (CPI-U). Note health care (purple line) is growing much faster than the rest of the components. 
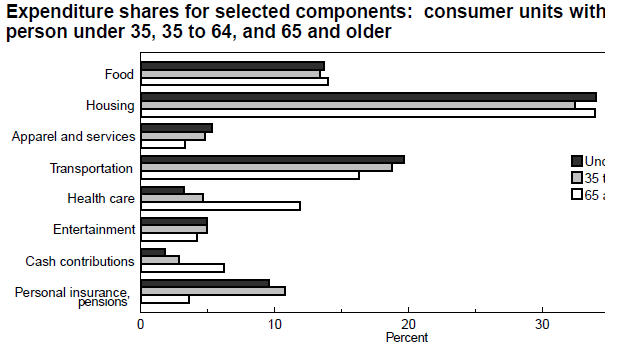
Consider that elderly makes less income than the younger groups – so the percentages of their total income allocated to health care is much larger than the population as a whole. The bar chart below is from the BLS which has an old study (based on 1998 data) on differences in spending patterns between various age groups. Note the difference in health costs (as percentage of income) for the group 65 and over.
[Note: the above chart was cut off on the right in the referenced document. The black bars are for family units under 35, the grey bar is for family units whose age was between 35 and 64, whilst the white bar is for family units ages 65 and older.]
This study based on 1998 data shows the elderly sector of the economy spent $24,000 annually per family unit. Note that the most recent data for calendar year 2011 shows the elderly sector spending $39,200 per family unit. If the 1998 data was indexed at 100, this means the index level for the 2011 data is 159.
[Note: There is no perfect way to calculate COLAs (cost-of-living adjustments). Two things happen simultaneously - prices change and the mix of what is purchased changes. Some of it is due to substitutions as prices rise and fall, whilst new products or services coming on line change purchasing priorities. One point is not debatable, most of the elderly live totally on social security benefits and live closer to the poverty line than the rest of the population. COLAs themselves limit elderly expenditures (as the poor tend to spend all their income). This makes COLAs for the elderly very difficult to manage IF your intention is to prevent the purchasing power of those benefits from eroding over time as prices rise.]
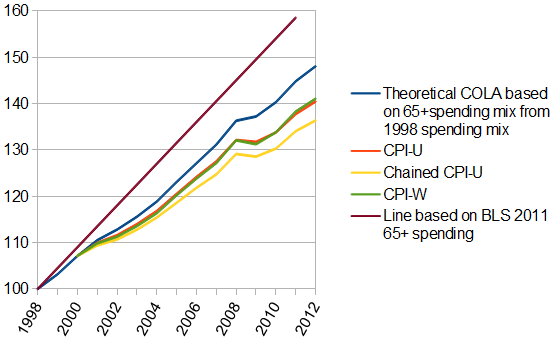
The graph below indexes the CPI-U (red line), CPI-W (green line and the current basis for Social Security COLAs), and Chained CPI (yellow line). The blue line below uses the CPI inflation elements of the FRED graph above (eg food, housing,medical, etc) using the 1998 65+ spending mix. 
The blue line suggests elderly expenditures should have increased to $35,000 per family unit by 2011 – yet the real increase in expenditure was $39,200 per family unit (purple line). The blue line was understated by nearly 15 points in 2011 based on real data, and Chained CPI underestimates the real data by 25 points or nearly 2% per year.
From an economics point of view, direct payments to its citizens flows directly to Main Street – missing the 0.1%. Cuts in Social Security directly impact private sector multipliers, and has a multiplied effect on GDP.
Social Security is not like Medicare which trickles down through the 0.1% who profit. Follow the money, and consider that no one benefits from short changing the elderly.
Other Economic News this Week:
The Econintersect economic forecast for April 2012 improved marginally, and is now in a zone which says the economy is beginning to grow normally. There are some warning signs that our interpretation is not correct – but we will see how these play out in the coming months. Not to end on a negative note, the majority of pulse points are improving.
The ECRI WLI growth index value has been weakly in positive territory for over four months – but in a noticeable improvement trend. The index is indicating the economy six month from today will be slightly better than it is today.
Current ECRI WLI Growth Index 
Initial unemployment claims fell from 352,000 (reported last week) to 339,000 this week. Historically, claims exceeding 400,000 per week usually occur when employment gains are less than the workforce growth, resulting in an increasing unemployment rate (background here and here).
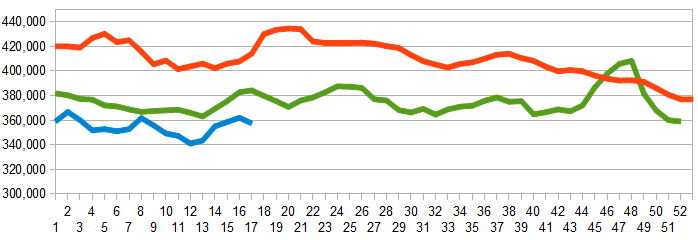
The real gauge – the 4 week moving average – slightly improved from 361,250 (reported last week) to 357,500. Because of the noise (week-to-week movements from abnormal events AND the backward revisions to previous weeks releases), the 4-week average remains the reliable gauge.
Weekly Initial Unemployment Claims – 4 Week Average – Seasonally Adjusted – 2011 (red line), 2012 (green line), 2013 (blue line) 
Bankruptcies this Week: none
Data released this week which contained economically intuitive components(forward looking) were:
- Rail movements remain mixed.
Weekly Economic Release Scorecard:
Click here to view the scorecard table below with active hyperlinks

