Computer Sciences Corporation (CSC) is engaged in the information technology (IT) and professional services industry. CSC offers an array of services to clients in the commercial and government markets and specializes in applying contemporary practices towards the employment of IT in order to achieve the strategic objectives of its customers.
The company was up yesterday on an earnings report. Here’s a snippet that summarizes the results:
"Shares of government IT contractor Computer Sciences Corp. are trading sharply higher Wednesday following the company’s financial report for the fiscal third quarter ended December 30, which featured much higher profits than the Street had expected on a non-GAAP basis.
For the quarter, the company reported revenue of $3.76 billion, including a $204 million “reduction” relating to the company’s U.K. National Health Services contract. Excluding that item, revenue was $3.97 billion, down 0.7% from a year ago, and about in line with the Street at $3.98 billion.
Profits in the quarter on a non-GAAP basis was $1.35 a share, dramatically above the Street consensus at 58 cents. On a GAAP basis the company lost $8.97 a share due to several impairment charges.
The company signed up $4.1 billion in new contracts in the quarter; year-to-date new contracts total $13 billion, up 26% from the same period last year." -- Source: Forbes via Yahoo! Finance -- Computer Sciences Shares Soar After Big FY Q3 EPS Beat, written by Eric Savitz.
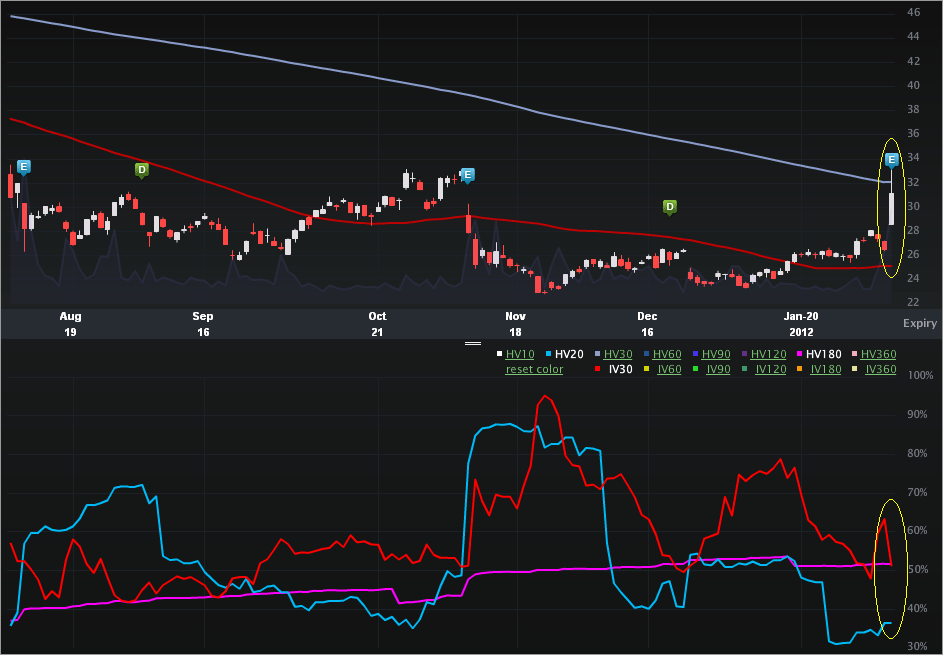
A while ago CSC was actually in the news because of an overwhelming bearish sentiment – from some of the big boys (Goldie included, I believe). In any case, it ain’t down today. Let’s turn to the Charts Tab (six months), below. The top portion is the stock price, the bottom is the vol (IV30™ - red vs HV20™- blue vs HV180™- pink).

We can see on the last earnings report (look for that blue “E” icon) the stock gapped down from $32.97 to $25.24 two days after earnings. Today, the stock has climbed most of the way back. On the vol side we can see how elevated the implied had gotten when the bears were out roaring, though the stock kinda hung in there. Today the IV30™ has dipped substantially off of the earnings report – which is expected behavior.
This becomes interesting when looking at the Skew Tab.

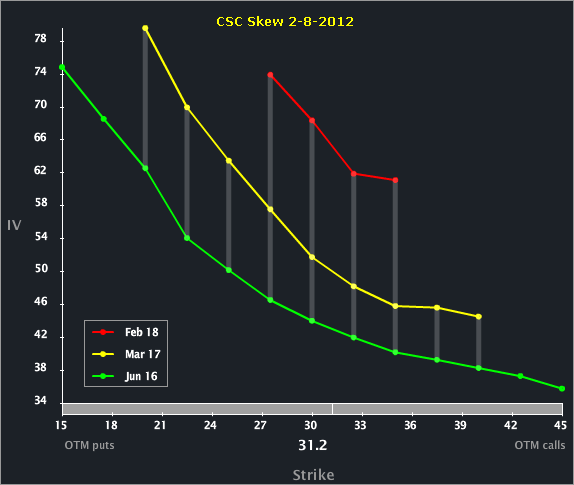
While all three of the front expiries show similar shapes, we can see that the front is still substantially elevated to the back. This is very similar to the skew of CSTR just yesterday off of a big move up after earnings.
Finally, let’s look to the Options Tab, for completeness.

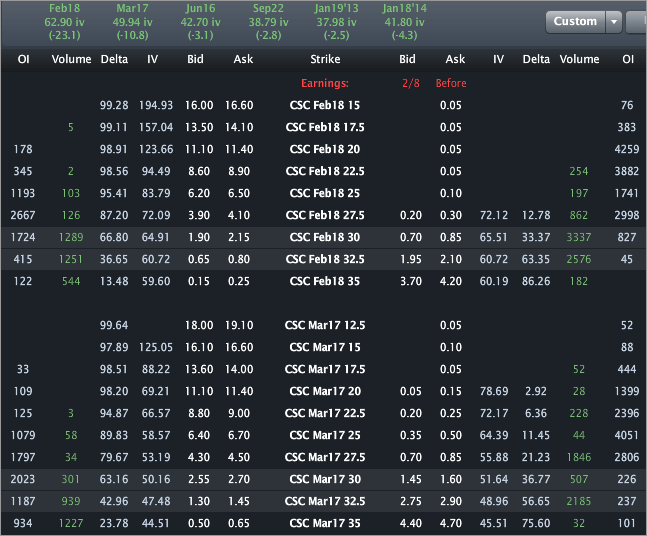
I wrote about this one for TheStreet (OptionsProfits), so no specific trade analysis here. But, we can see that Feb is still priced to 62.90% while Mar and Jun are priced to 49.94% and 42.70%, respectively. Further, we can see that Feb 30 puts are priced to half the value of the Mar 30 puts, though Feb has 1.5 weeks left, and Mar has, ya know, a lot more than that.
This is trade analysis, not a recommendation.
The company was up yesterday on an earnings report. Here’s a snippet that summarizes the results:
"Shares of government IT contractor Computer Sciences Corp. are trading sharply higher Wednesday following the company’s financial report for the fiscal third quarter ended December 30, which featured much higher profits than the Street had expected on a non-GAAP basis.
For the quarter, the company reported revenue of $3.76 billion, including a $204 million “reduction” relating to the company’s U.K. National Health Services contract. Excluding that item, revenue was $3.97 billion, down 0.7% from a year ago, and about in line with the Street at $3.98 billion.
Profits in the quarter on a non-GAAP basis was $1.35 a share, dramatically above the Street consensus at 58 cents. On a GAAP basis the company lost $8.97 a share due to several impairment charges.
The company signed up $4.1 billion in new contracts in the quarter; year-to-date new contracts total $13 billion, up 26% from the same period last year." -- Source: Forbes via Yahoo! Finance -- Computer Sciences Shares Soar After Big FY Q3 EPS Beat, written by Eric Savitz.
A while ago CSC was actually in the news because of an overwhelming bearish sentiment – from some of the big boys (Goldie included, I believe). In any case, it ain’t down today. Let’s turn to the Charts Tab (six months), below. The top portion is the stock price, the bottom is the vol (IV30™ - red vs HV20™- blue vs HV180™- pink).

We can see on the last earnings report (look for that blue “E” icon) the stock gapped down from $32.97 to $25.24 two days after earnings. Today, the stock has climbed most of the way back. On the vol side we can see how elevated the implied had gotten when the bears were out roaring, though the stock kinda hung in there. Today the IV30™ has dipped substantially off of the earnings report – which is expected behavior.
This becomes interesting when looking at the Skew Tab.

While all three of the front expiries show similar shapes, we can see that the front is still substantially elevated to the back. This is very similar to the skew of CSTR just yesterday off of a big move up after earnings.
Finally, let’s look to the Options Tab, for completeness.

I wrote about this one for TheStreet (OptionsProfits), so no specific trade analysis here. But, we can see that Feb is still priced to 62.90% while Mar and Jun are priced to 49.94% and 42.70%, respectively. Further, we can see that Feb 30 puts are priced to half the value of the Mar 30 puts, though Feb has 1.5 weeks left, and Mar has, ya know, a lot more than that.
This is trade analysis, not a recommendation.
