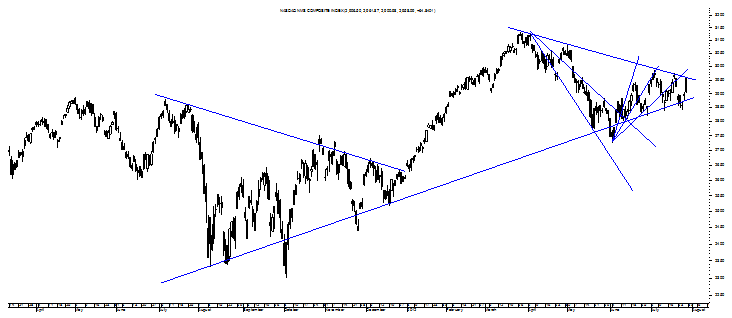
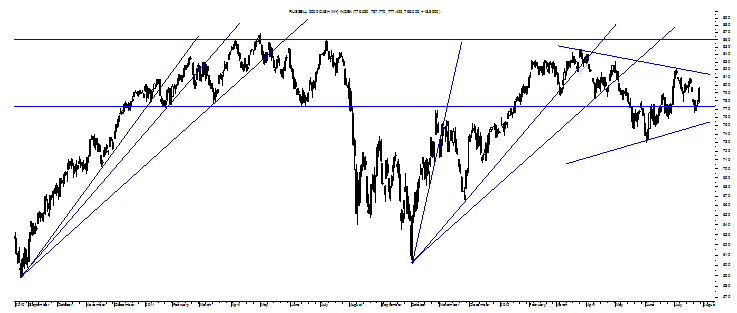
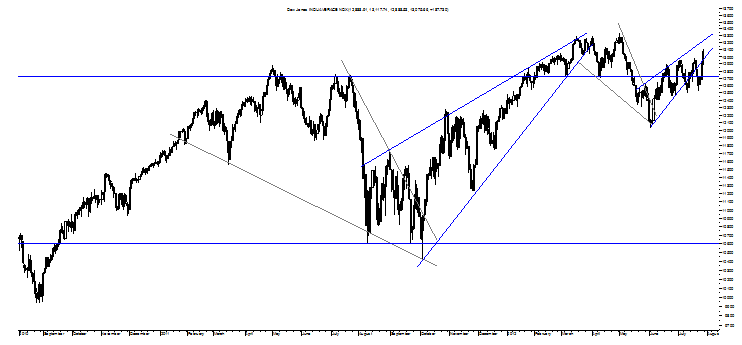
Having missed most of Day 2 of the Draghi Rally, it was interesting to see the sum of the charts after the event with three big dichotomies showing up with one playing out through the differing messages of the growth-oriented Nasdaq Composite and Russell 2000 the more “old” economy Dow Jones Industrial Average and S&P with the difference boiling down to lower highs versus near-term higher highs.
Starting out with the Nasdaq Composite, its lower highs are not only representing the near-term but the intermediate-term in the form of a third Bull Fan Line that may just mean it will be breached to the upside for a Symmetrical Triangle that will try to fulfill up as occurred at the beginning of this year on the LTRO – and not just words – of Draghi. What makes this far from a sure thing, however, is the fact that the Nasdaq Composite’s near-term uptrend is actually reversing down as shown by its position below that third near-term Bull Fan Line and, of course, the fact that lower highs typically do not bode so well for the marketplace being charted. 
These are not typical times, though, with investors continuing to be herded by hope as opposed to looking at reality and perhaps a good reason to think that the Russell 2000’s more than year-long trend of lower highs shown in the chart directly above will continue to hold as hope fails to spring eternal in the face of Europe’s sovereign debt and banking crisis.
Such a bearish trend will remain in place even if the Russell 2000 pops higher to put in another top trendline touch of its Symmetrical Triangle at about 815 this coming week with this small cap index’s reversing intermediate-term uptrend supporting a continuation of those lower highs along with the Symmetrical Triangle’s target of 626 for a potential decline of more than 20%.
Worrisome about these lower highs from the Nasdaq Composite – in particular considering its decade-breaking high months ago – and the Russell 2000 is the fact that these growth-oriented indices tend to lead the Dow Jones Industrial Average and the S&P on genuine moves to the upside and with each holding back, it may be reason to think that the near-term higher highs in the latter two indices will fail to hold. 
This is certainly the “eyeball” look of the Dow’s daily chart above, but it must be noted that the Dow’s three month downtrend trend is officially reversing up with its two-month uptrend completely intact and something that is simply not happening in the Nasdaq Composite or the Russell 2000 adding to the drama of what “side” will win this battle of lower highs versus near-term higher highs.
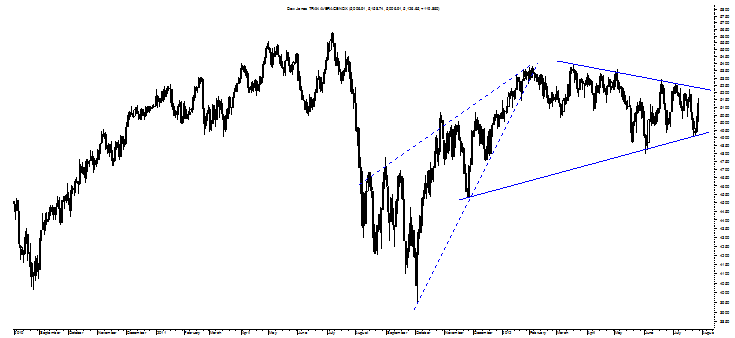
Without showing the S&P here and saving it for a note on one of the other big dichotomies born of the Draghi Rally, let’s turn to one last chart that perhaps provides reason to believe that the typical tells on how the risk assets will behave – the Nasdaq Composite and the Russell 2000 – and that is the chart of the Dow Transports and one that presents as the Russell 2000 does and this is to say poorly.
As can be seen in the daily chart of the Dow Transports on the following page, it, too, is showing a more than one-year trend of lower highs under the guidance of a Symmetrical Triangle as well.
Should these lower highs be breached to the upside on an unmarked Bull Wedge that hits its target as opposed to the partial fulfillments of the previous Bull Wedges, it will make the strong case for an upside break from this year’s sideways trend in the equity indices rather than a downside break. 
But it is the confirmed and fulfilling Rising Wedge in dashed trendlines that strongly suggests these lower highs will hold and something that could cause the Dow Transports to decline by 20% over the next quarter or two.
Clearly the lower highs in the Transports will either be busted or hold simultaneous to similar trading action in the Nasdaq Composite and the Russell 2000 with the combination of the three a good way to balance the possible bullishness building in the Dow Jones Industrial Average and the S&P with the two sets of charts sending different signals right now on how the sideways uncertainty will end.
Put another way, it is going to be interesting to see whether it is the COMPQ and RUT or INDU and SPX that turn out to be right about another sideways summer for the equity markets.
- English (UK)
- English (India)
- English (Canada)
- English (Australia)
- English (South Africa)
- English (Philippines)
- English (Nigeria)
- Deutsch
- Español (España)
- Español (México)
- Français
- Italiano
- Nederlands
- Português (Portugal)
- Polski
- Português (Brasil)
- Русский
- Türkçe
- العربية
- Ελληνικά
- Svenska
- Suomi
- עברית
- 日本語
- 한국어
- 简体中文
- 繁體中文
- Bahasa Indonesia
- Bahasa Melayu
- ไทย
- Tiếng Việt
- हिंदी
COMPQ And RUT Or DJIA And SPX?
Published 07/29/2012, 12:19 AM
Updated 07/09/2023, 06:31 AM
COMPQ And RUT Or DJIA And SPX?
Latest comments
Loading next article…
Install Our App
Risk Disclosure: Trading in financial instruments and/or cryptocurrencies involves high risks including the risk of losing some, or all, of your investment amount, and may not be suitable for all investors. Prices of cryptocurrencies are extremely volatile and may be affected by external factors such as financial, regulatory or political events. Trading on margin increases the financial risks.
Before deciding to trade in financial instrument or cryptocurrencies you should be fully informed of the risks and costs associated with trading the financial markets, carefully consider your investment objectives, level of experience, and risk appetite, and seek professional advice where needed.
Fusion Media would like to remind you that the data contained in this website is not necessarily real-time nor accurate. The data and prices on the website are not necessarily provided by any market or exchange, but may be provided by market makers, and so prices may not be accurate and may differ from the actual price at any given market, meaning prices are indicative and not appropriate for trading purposes. Fusion Media and any provider of the data contained in this website will not accept liability for any loss or damage as a result of your trading, or your reliance on the information contained within this website.
It is prohibited to use, store, reproduce, display, modify, transmit or distribute the data contained in this website without the explicit prior written permission of Fusion Media and/or the data provider. All intellectual property rights are reserved by the providers and/or the exchange providing the data contained in this website.
Fusion Media may be compensated by the advertisers that appear on the website, based on your interaction with the advertisements or advertisers.
© 2007-2025 - Fusion Media Limited. All Rights Reserved.
