Everyone is nervous about something to do with the US government these days. But whether you are for The Wall or against it, for Obamacare or want it repealed, we seems to all rally around a desire for a strong economy and currency. These other issues have made for a complicated relationship with the US dollar Index. So what exactly is our relationship status?
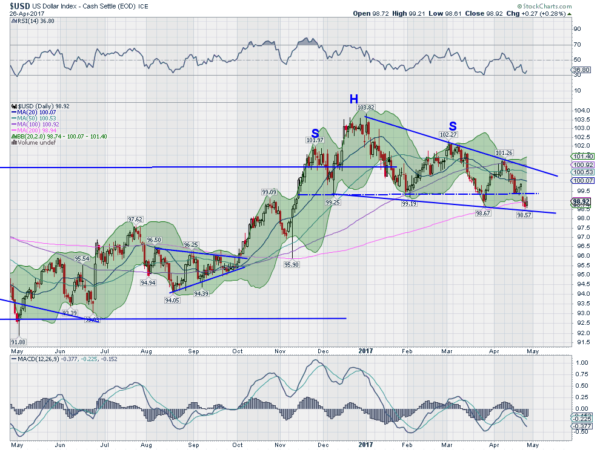
The chart below can help explain some of the complication. The first thing you see is a break out of a long broad channel in November. This quickly failed and it fell back. Another push to the upside in December made a higher high and then also failed. A third push in February made a lower high in March and when it fell back triggered a head and shoulders top when it broke the neckline at the end of the month. But no sooner did that happen then it found support and bounced back over the neckline.

The bounce stalled when it reached its 100 day SMA at another lower high. It did not exceed the right shoulder, leaving the head and shoulders pattern valid. The fall back to the current low moved through the neckline again and to a slightly lower low. Here is where the complication comes in.
The series of lower highs and lower lows, a trend lower, aligns with the head and shoulders pattern, pointing lower. But it also is building a falling wedge pattern. Falling wedges, after a run up like the one from the bottom of the channel consolidation to the breakout high, often break and run to the upside.
The break of a falling wedge to the upside is not a hard and fast rule, but poses a dilemma. or at least raises a bit of a cautious approach to a short dollar stance. A break of the wedge lower would remove that caution. Keep an eye here. It’s complicated.
Disclaimer: The information in this blog post represents my own opinions and does not contain a recommendation for any particular security or investment. I or my affiliates may hold positions or other interests in securities mentioned in the Blog, please see my Disclaimer page for my full disclaimer.
