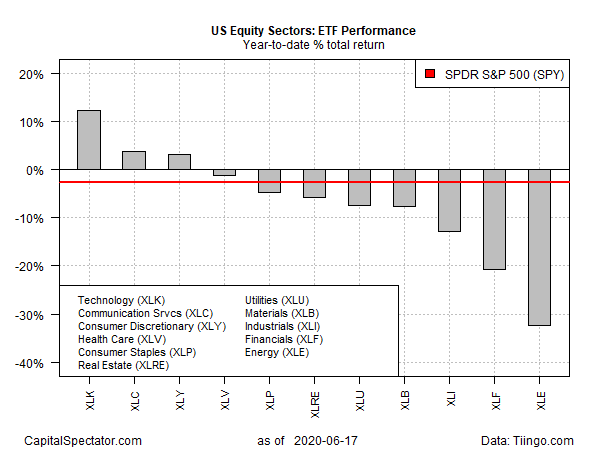
And then there were three—three US equity sectors with year-to-date gains. Communications services and consumer discretionary shares have recently joined technology stocks by posting positive performance for 2020, based on a set of exchange traded funds. The remaining eight sectors, by contrast, are still in the red.
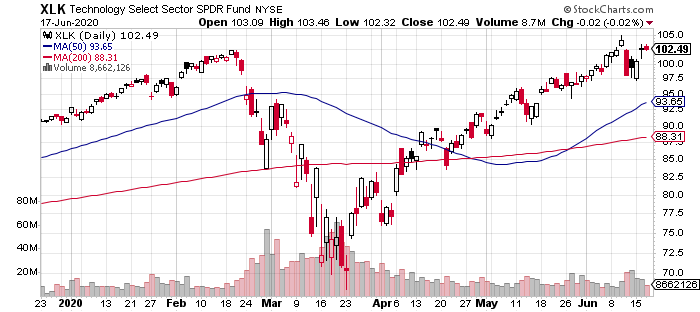
Tech continues to lead the field by a wide margin, based on results through June 17. Technology Select Sector SPDR (XLK) is up 12.4% so far this year.
David Kostin, head of US equity strategy at Goldman Sachs, and his team this week predicted that “earnings damage resulting from the virus will ultimately be short-lived.” They also advised that tech shares will continue to attract investor attention due to “quality attributes, including strong balance sheets and high profit margins, as well as the resilience of its earnings.”

Tech comes with risks as well, Goldman’s analysts noted. “Major risks to the sector include its popularity, which could cause underperformance in the event of a sharp investor derisking, as well as the possibilities of government regulation and tax reform.”
Tech is no longer the lone sector with year-to-date gains. Joining the party in recent weeks: Communication Services Select (NYSE:XLC) and Consumer Discretionary Select (NYSE:XLY), which are up 3.8% and 3.2%, respectively, in 2020.

The handful of year-to-date sector gains stand out against a backdrop of broadly negative results for the year so far. Although the market overall has rallied, the equity benchmark SPDR S&P 500 (NYSE:SPY) is still underwater for 2020. SPY was briefly in positive territory for the year earlier in June, but at the moment the ETF is down 2.6% year to date.
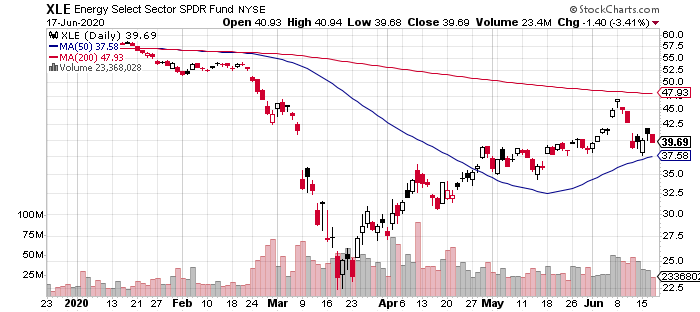
The bulk of the US equity sector space is posting losses in varying degrees for 2020. Energy continues to suffer the deepest setback. Energy Select Sector (NYSE:XLE) has tumbled 32.3% in 2020. The fund had been rallying, but so far in June, XLE has been treading water, as investors reconsider the outlook for energy demand.

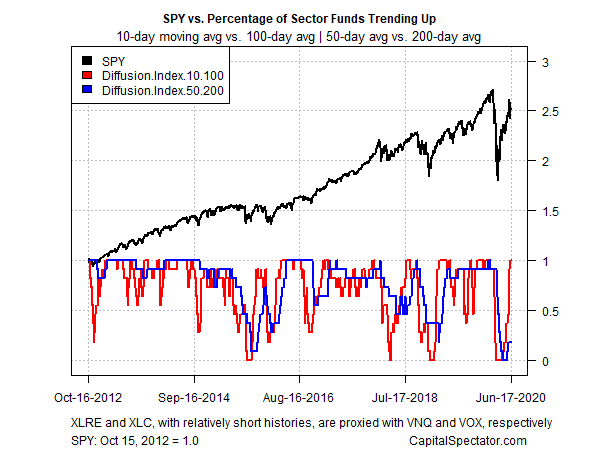
Profiling all the sector ETFs listed above through a momentum lens shows a strong rebound in the short-term upside bias. The profile in the chart below is based on two sets of moving averages. The first measure compares the 10-day average with its 100-day counterpart — a proxy for short-term trending behavior (red line in chart below).
A second set of moving averages (50 and 200 days) represent an intermediate measure of the trend (blue line). Using data through yesterday’s close shows that bullish short-term momentum overall has bounced back dramatically, across the board. Longer-term momentum (blue line), however, has yet to confirm the recent rally.

