Investing.com’s stocks of the week
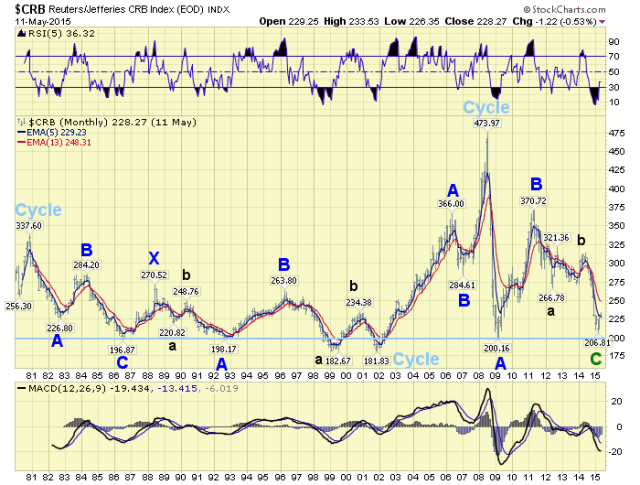
My last commodity update, here, detailed our bearish view on most of the sectors. Since then, during 2013/2014, many commodity sectors have sold off. This update will suggest some sectors may have just started Primary wave counter-trend rallies that could last for a few years. First a look at commodities in general via the CRB Index.

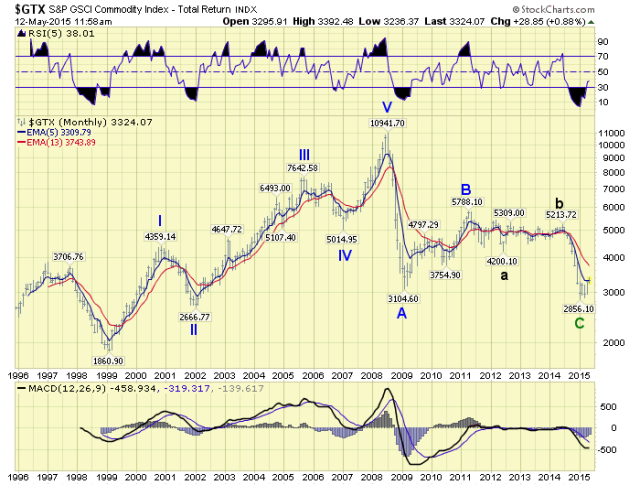
The CRB was the standard to measure the commodity index until Goldman Sachs (NYSE:GS) introduced a consumption weighted index, the GTX. Notice the 21 year bear market pattern in the CRB from 1980-2001, a double three (abc-x-abc). A similar pattern should unfold during the current 20 year bear market.

The GTX displays a slightly different pattern for its bull market from 1999-2008. While the CRB was late to get started, and only displayed an abc. The GTX started earlier and completed a five wave pattern into its bull market high. After that high they both begin to look quite similar. Recently, however, the GTX appears to have completed a complex flat from 2008-2015. This suggest a bear market counter-trend X wave may be underway from the recent low, lasting a few years, with a potential to rise back to around 5,000.

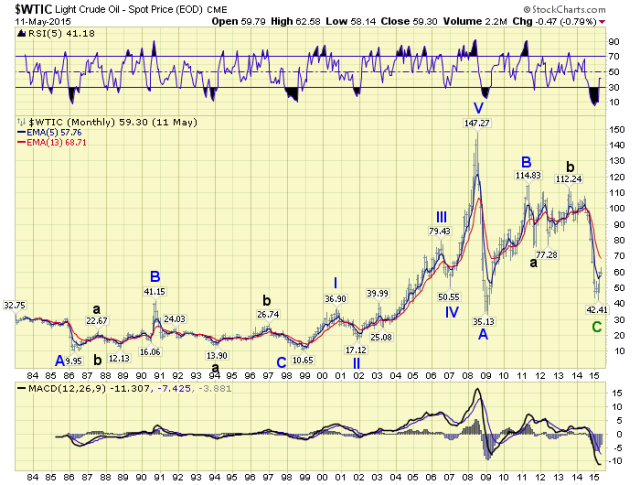
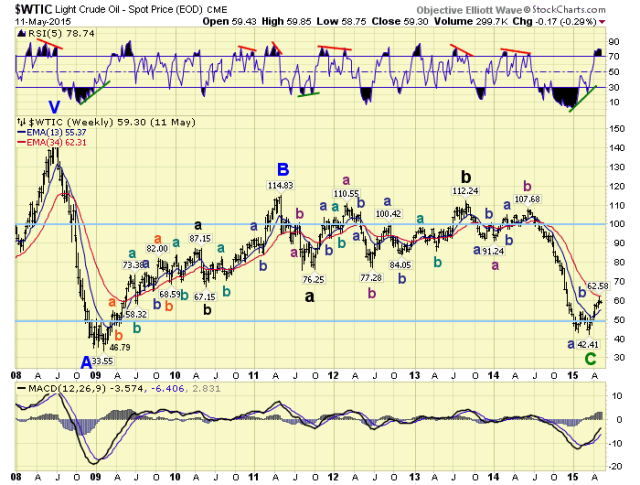
Since Crude oil is heavily weighted in the GTX, this is goods news for the producers. The recent low has created a failed flat here, which is generally more positive. In fact, over the next few years, Crude could trade between $50 and $100. But the rise will probably be choppy like the wave rally between 2009 and 2011, see below.
