The article aims to provide forecasts for commodity prices (World Bank’s Pink Sheets) for November 2016. The Pink Sheet is a monthly statistical report on prices of major agricultural commodities: metals, minerals, energy and fertilizers (1960-2016). Monthly prices for the series are published at the beginning of each month. The Pink Sheets for November 2016 will be released on December 2, 2016.
The prices are positively correlated with the futures prices (see article for the May forecasts). Because of both high positive correlation and accuracy of forecasted values it could be recommended to check the values provided in this post. They can be used for identifying price trends of commodity futures.
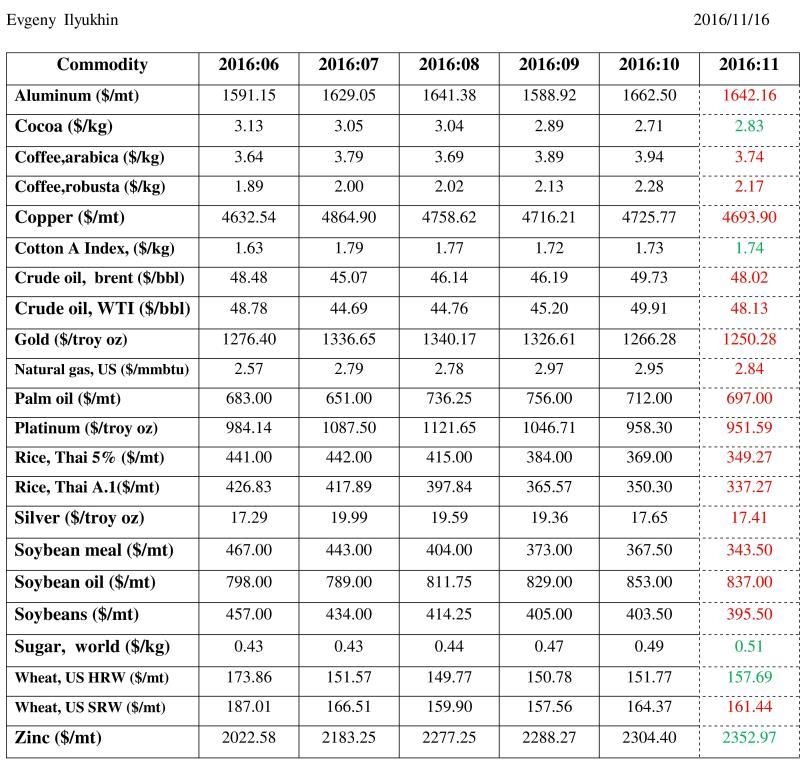
The monthly commodity prices in nominal US dollars over the period from June 2016 to October 2016 (World Bank’s Pink Sheets) and forecasted period (Author’s Calculations) - November 2016 are presented in table below (futures related commodities only). Forecasts are projected with an Autoregressive Integrated Moving Average (ARIMA) model based on monthly historical data that is relevant for calculations.
Commodities are placed in alphabetical order. Forecasted values: increase in green; decrease in red. It is advised to use forecasted values for identifying the short-term price trends over the period firstly. The notable positive changes are expected for cocoa (4.43%), sugar (4.08%) and US HRW wheat (3.90%). Soybean meal (-6.53%), Thai rice 5% (-5.35%), Arabica coffee (-5.08%) will likely drop in price over the period.
Which stock should you buy in your very next trade?
With valuations skyrocketing in 2024, many investors are uneasy putting more money into stocks. Unsure where to invest next? Get access to our proven portfolios and discover high-potential opportunities.
In 2024 alone, ProPicks AI identified 2 stocks that surged over 150%, 4 additional stocks that leaped over 30%, and 3 more that climbed over 25%. That's an impressive track record.
With portfolios tailored for Dow stocks, S&P stocks, Tech stocks, and Mid Cap stocks, you can explore various wealth-building strategies.

