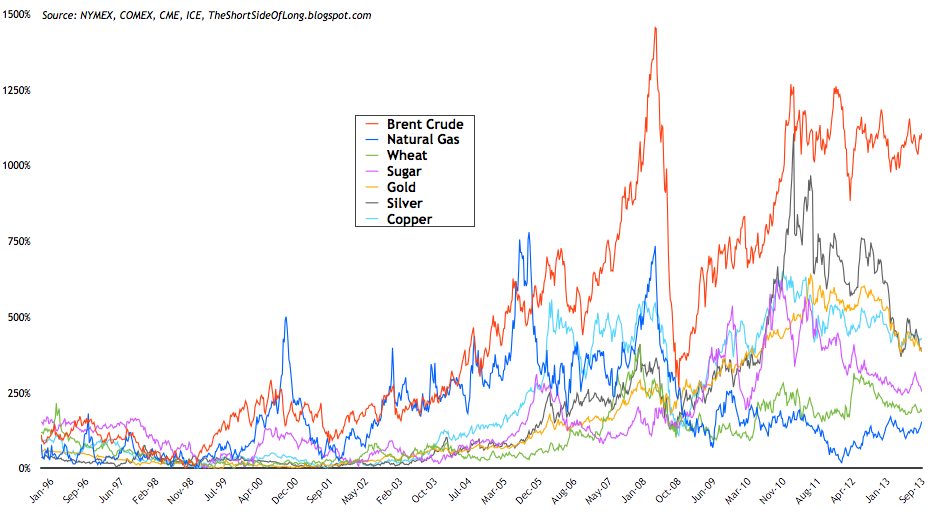
Chart 1: Secular commodities bull market started between 1998 and 2001 With every other blog on the internet continuously focusing on the the equity market (which has already performed exceptionally well over the last 1 year, 3 year and 5 year time frames), I continue to focus on where the long term bull market and value is - commodities.
However, not all commodities are equal, the same way that not all stocks are equal either. The chart above shows that various commodities are extremely undervalued in both nominal and inflation adjusted terms (not shown here), while other commodities are rather on the expensive side. Let's review the three main sectors:
- The energy sector of the commodity bull market is the most expensive, excluding the Natural Gas story. Consider the fact that into the 2008 peak, Brent Crude Oil almost achieved a 15 times return from the lows in 1998. Similar story can be seen with other blends of Crude as well as Gasoline and Heating Oil too.
- The agricultural sector of the commodity bull market is the cheapest by and large. Not only are majority of these agricultural commodities super cheap on nominal basis relative to their peaks throughout 1970s, but when adjusted for inflation... they are just ridiculously cheap to the point that they remain 80 to 90 percent from their real peaks. Enough said!
- The metal sector of the commodity bull market is rather mixed. Tradable metal commodities on the Comex like Gold, Silver and Copper are cheaper then the energy sector, but more expensive then agricultural commodities. Certain other base metals like Nickel and Aluminium are even cheaper.
Fundamental analysis aside, I continue to favour commodities such as Sugar and Silver. Both have not reached all time new highs in nominal value for at least 3 decades (in the case of Sugar 4 decades now). When adjusted for inflation, both commodities are extremely cheap... ridiculously cheap.
