Daily Gold, Silver and WTI charts highlight key levels and patterns.
Gold Daily
- Gold prices are coiling above October’s high.
- The trend remains firmly bullish within an ascending channel.
- A break above 1250.63 confirms a bullish breakout, a counter-trend break of 1241.11 warns of a deeper correction.

Silver Daily
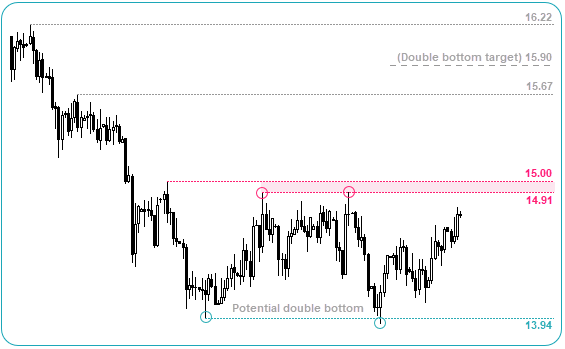
- Silver remains in a sideways range, but a clear break above 14.91- 15.00 confirms a double bottom.
- Range trading strategies are preferred between the 13.94 – 15.00 area.
- Look for reversal patterns near support and resistance, as they have been a prominent feature of this range.

WTI Daily
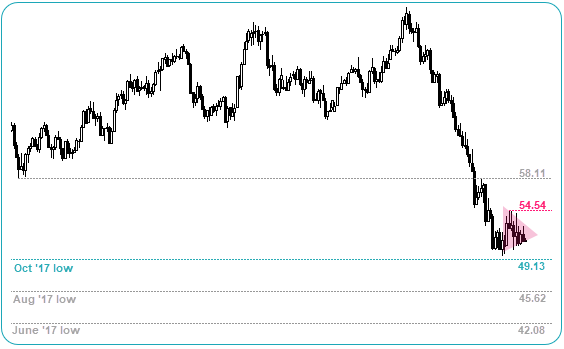
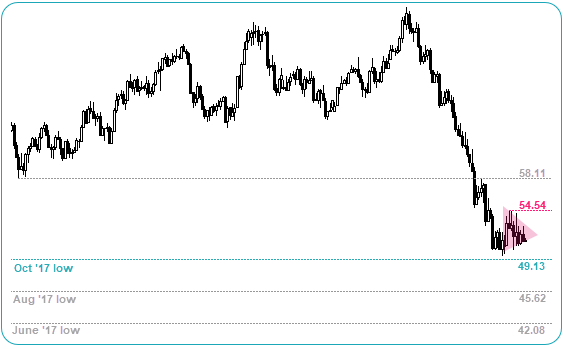
- Crude oil is coiling to suggest a volatile move is pending.
- With the trend clearly bearish, a break of 49.13 brings 45.62 and 42.08 lows into focus.
- However, the lack of near term mean reversion would mean a counter-trend break above of 54.45 would see likely see a move to the 58.11.

3rd party Ad. Not an offer or recommendation by Investing.com. See disclosure here or remove ads.
Which stock should you buy in your very next trade?
AI computing powers are changing the stock market. Investing.com's ProPicks AI includes 6 winning stock portfolios chosen by our advanced AI. In 2024 alone, ProPicks AI identified 2 stocks that surged over 150%, 4 additional stocks that leaped over 30%, and 3 more that climbed over 25%. Which stock will be the next to soar?
Unlock ProPicks AI