For several of the currency majors, last week was one of divergence, with the commodity dollar currencies of the Aussie dollar, the Canadian dollar and the New Zealand dollar, all continuing lower and picking up bearish momentum once more. For the British pound and the single currency, the weekly price action saw a modest recovery for the euro and a further period of consolidation for cable, both reflective of the pause in the US dollar which closed the week marginally lower for only the second time since early December 2014

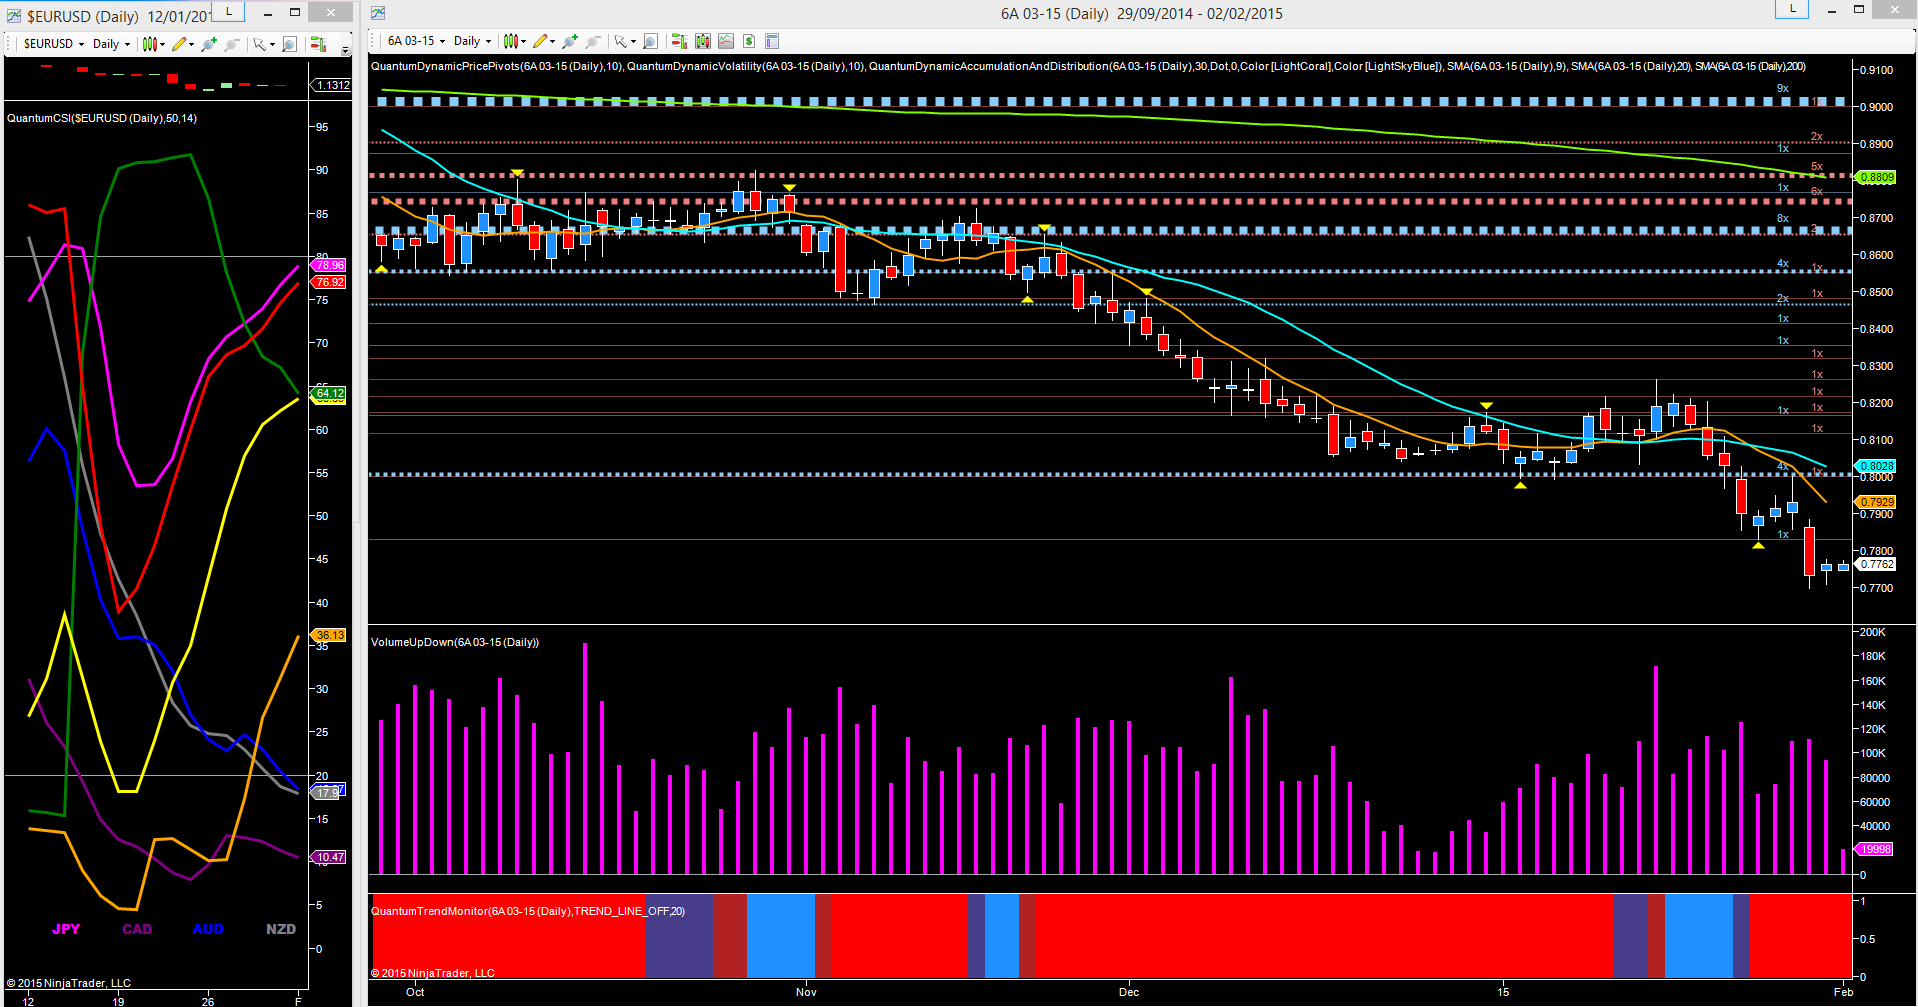
Starting with the 6A futures contract and the daily chart, and as outlined in my market analysis of the 26th January, I suggested that any move through the 0.8020 region would then see a pick up in the bearish momentum once again. This was duly delivered on Thursday, with the strong move through the minor support region in the 0.7820 area, associated with good volume, confirming and validating the move lower. The previous day’s price action had already signaled weakness, with the effort to rally snuffed out by the deep resistance in place at the 0.8020 region, and with the commodity currencies all suffering, on further weak economic data from China, the longer term outlook for the AUD/USD remains very bearish.
From a fundamental perspective the AUD/USD was also impacted last week by rumours the RBA would definitely be cutting interest rates this week, and is a view given credence by several large institutions over the weekend. However, last week’s rumour may simply have been a ploy to prepare the market for a potential cut, thereby avoiding the volatility seen last month with both the Swiss franc and Canadian dollar.
Moving to the currency strength indicator to the left of the chart, here we can see the red line, the US dollar continuing to rise towards the overbought region on the daily chart, but with some way left to go before penetrating this area. To the bottom of the indicator, the blue line, the Aussie dollar is just starting to move into the oversold region on the indicator, but again, with a little way to go and confirming the bearish technical picture for the pair.
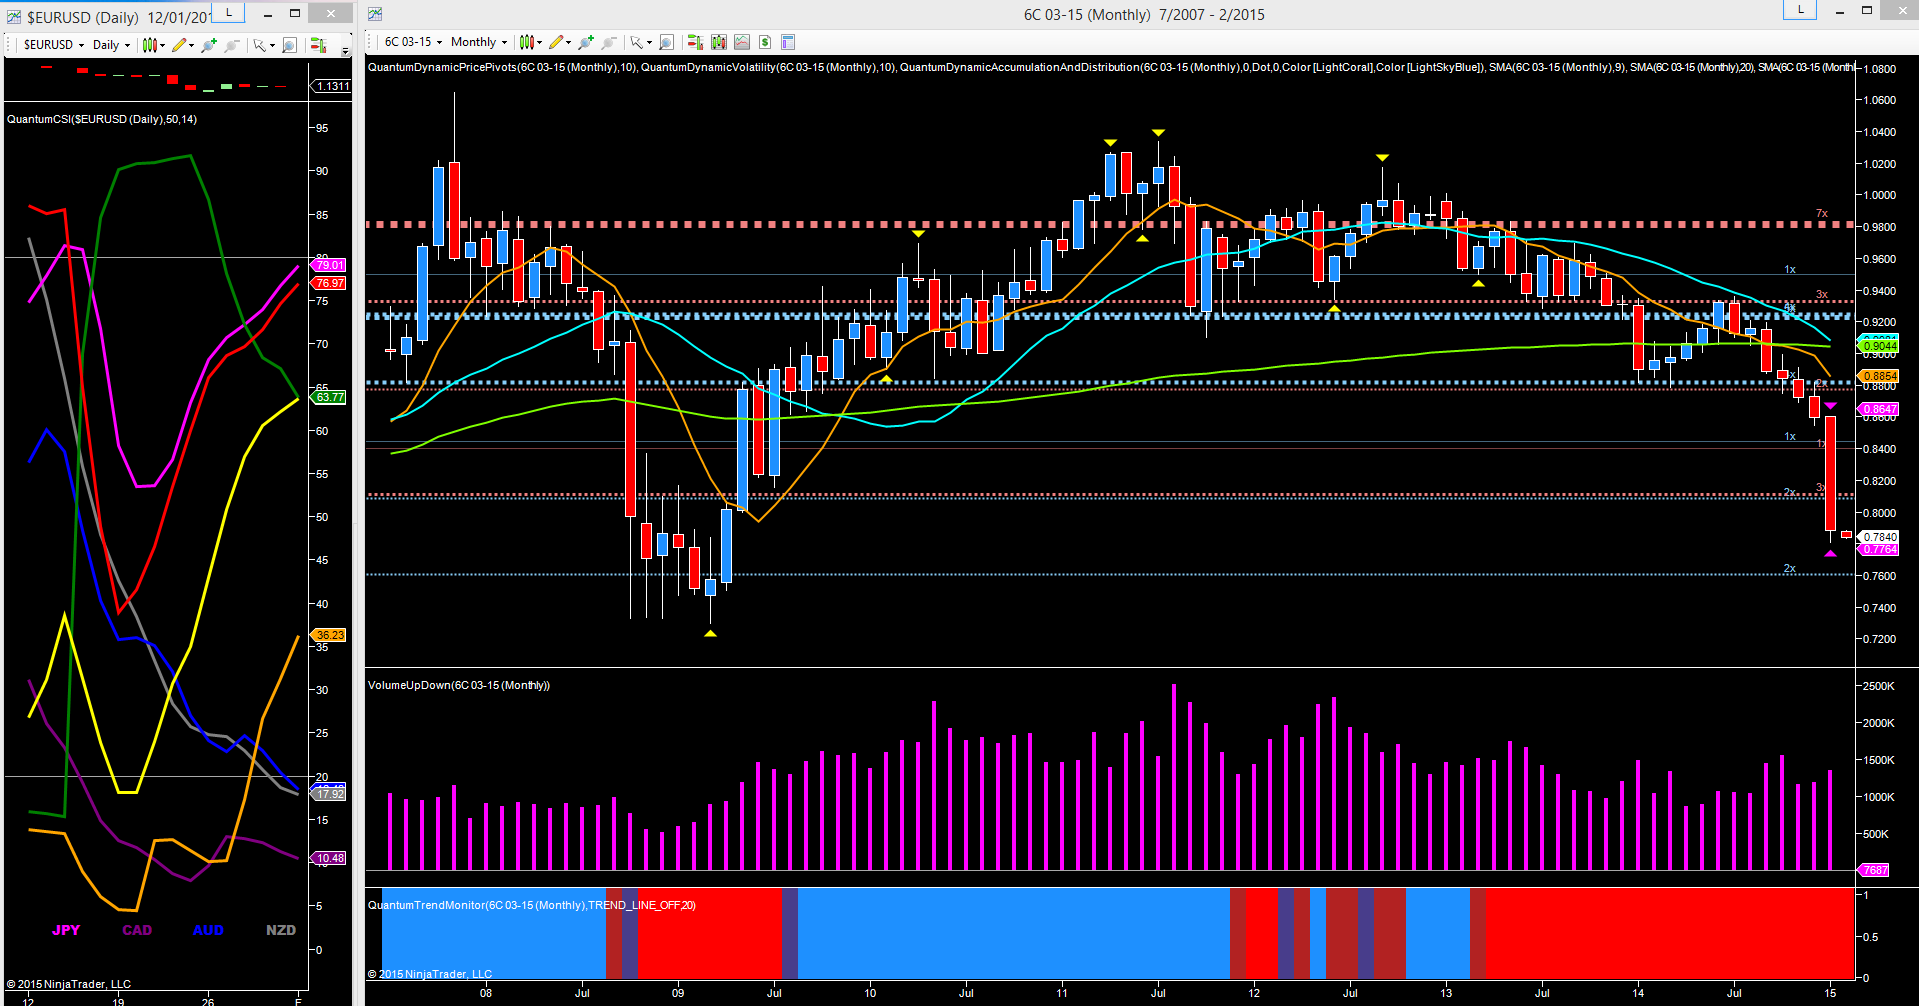
For the Canadian dollar and the 6C futures contract, the picture here is even clearer, with the bearish momentum of last week clearly in evidence, and with a falling market on rising volumes, merely confirming this through the prism of volume price analysis. The trend monitor continues to remain firmly red at the bottom of the chart, and with the next level of potential support now in place at the 0.7600 region, this is a level we are likely to see tested in due course.
Finally moving to the currency strength indicator on the left, the Canadian dollar, the purple line, continues to remain deep in the over sold area on the indicator, and is now looking to push deeper still with the US dollar continuing to rise. Any recovery or pause in oil prices may help to provide some stability to the pair in the medium term, but for the time being negative sentiment remains firmly in place for the CAD/USD pair.

