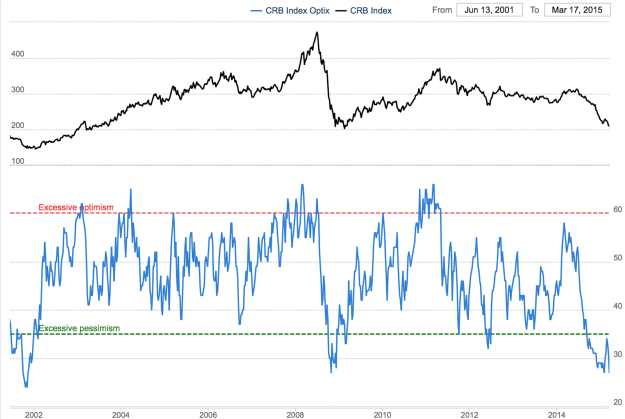
Chart 1: Commodities have crashed back to levels seen in 2001 And 2009

We have been following the strength of the US dollar for awhile and its impact on various asset classes throughout the second part of 2014 and the first quarter of 2015. A major story that we have touched on, but not discussed in-depth, is the crash in commodity prices over the last 9 months.
Those who follow my blog regularly should probably remember from previous posts that many of the individual commodities are down between 50 to 70 percent from their respective 2011 peaks. But what about commodities as a whole? Observing Chart 1, the most popular of commodity indices tends to be the Thomson Reuters CRB Index.
Over the last 35 years, this level has been very significant. Firstly, the commodity bull market that peaked in the late 1980's eventually bottomed out around the 200 level in 1986. This level was later re-tested once again in 1992, during another commodity bear market. Secondly, the major double bottom in commodity prices occurred in 1999 and 2001, both of which saw the 200 level violated only briefly (as a bear trap or a false breakdown).
Finally, during the GFC liquidation panic, the CRB Index found support at the 200 level once again, from which prices bounced very sharply.
Today, the CRB Index once again finds itself at the all important 200 level. In other words, commodity prices are still trading at the same level we saw in 1986, 1992, 1999, 2001 and 2009. If we adjust the CRB Index for inflation, prices are now significantly cheaper relative to the 1986 bottom, even though nominally the index is at the same level.
Since this area of historical support is extremely important, in my opinion, there is now above average chance that commodities could start forming yet another meaningful bottom. Mind you, this process could take awhile so patience is very important.
Technical indicators in Chart 1 are extremely oversold by any historical comparison, so a mean reversion is definitely in the cards. At the same time, Chart 2 shows that sentiment on the CRB Index is at rock bottom levels, usually witnessed at major bottoms.
Commodities aren't even hated anymore, the truth is majority of the media has totally forgotten about this asset class. Contrarians should look at this asset class very closely. My opinion continues to be that the best way to play commodities is through Precious Metals, and especially silver.
Chart 2: Sentiment is now extremely bearish similar to 2001 And 2009 bottoms

