Geopolitical tensions in Libya and Iraq pushed oil prices and gold higher on Monday. The soft commodities are mixed amid uncertain outlooks after the US-China trade deal.
Energy
CRUDE OIL prices rose on Monday, with West Texas Intermediate (WTI) hitting the highest level in 10 days. Libya’s oil production ground to a halt after armed forces shut down a pipeline, while Iraq also halted output at one field, with another one also threatened.
Prices have since eased back as the market decided non-OPEC supply would be enough to cover any shortfall. In addition, analysts are expecting the weekly stockpiles data from the American Petroleum Institute to show another solid increase in gasoline and distillates.
Speculative investors turned net sellers for the first time in six weeks in the week to January 14, according to the latest data snapshot from CFTC. That pulled net long positions from the most bullish levels in 18 months.
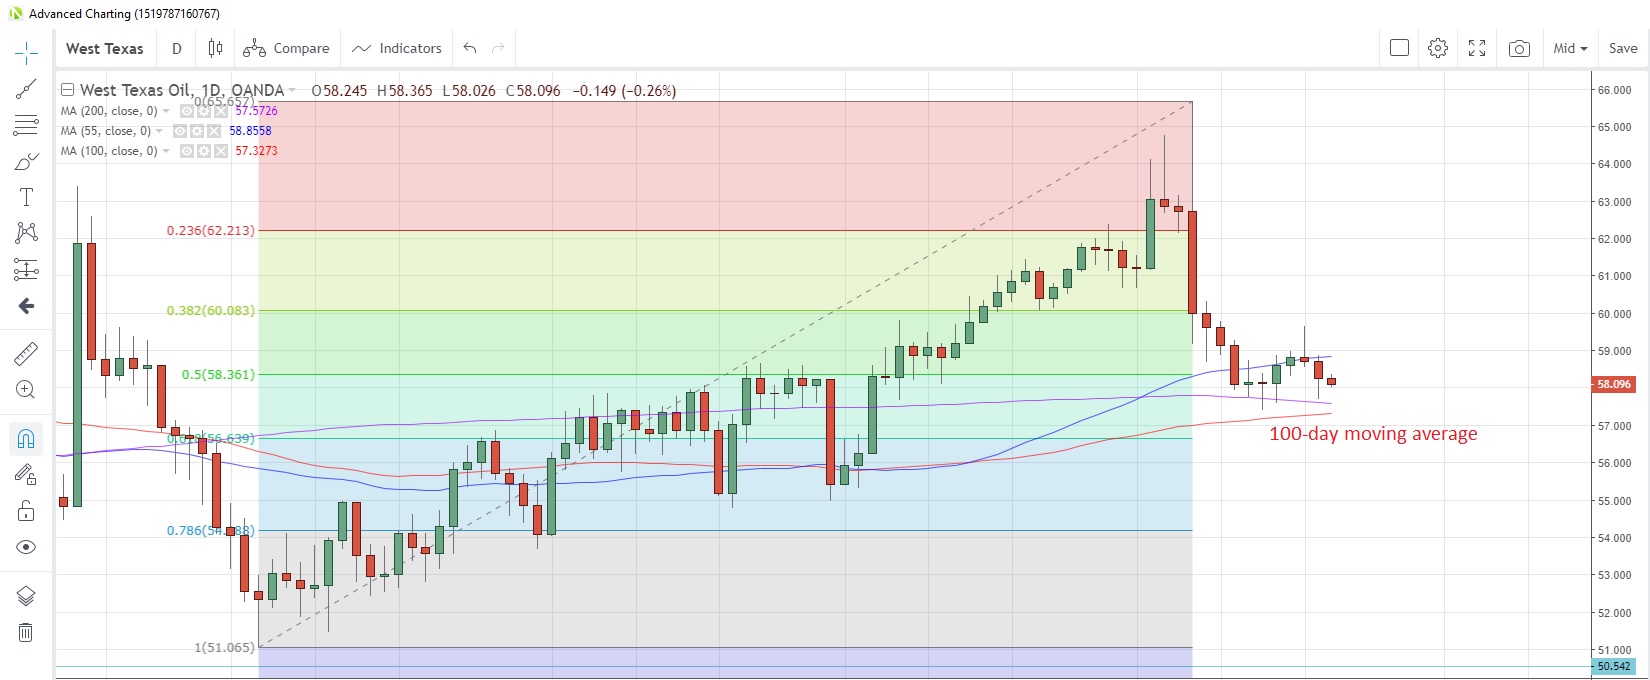
WTI is now back to just above the 200-day moving average, which was tested twice last week, while the 100-day moving average lurks below at $57.33, and has supported prices since December 3.
WTI Daily Chart

NATURAL GAS prices remain under pressure, touching the lowest level since March 2016 on Monday as a warm(ish) winter, high inventory levels and a global supply glut weigh. However, bulls may garner some consolation from a recent report from the Energy Information Administration which forecast that global supply will decline next year, and hopes that the recent US-China Phase 1 trade deal will bring respite from the selling as China increases its imports.
Prices closed below the $2 mark last week for the first time since May 2016 and, including today, has fallen for the past eight sessions. Speculative investors are at their most bearish on the commodity since June 2015, according to the latest data from CFTC.
Precious metals
GOLD prices look set to slide for a second straight day today, despite the deteriorating mood in financial markets due to the spreading of the Wuhan coronavirus. Speculative investors reduced net long positions for a second consecutive week in the week to January 14 as prices failed to hold above the 1,600 mark.
SILVER likewise has been on the defensive since the start of the week, reaching the lowest level in four weeks yesterday. Bullish speculative investors increased their long positions for a fifth consecutive week to January 14, according to the latest data from CFTC, pushing long positions to the highest in six months. Net positioning was little changed on the week.
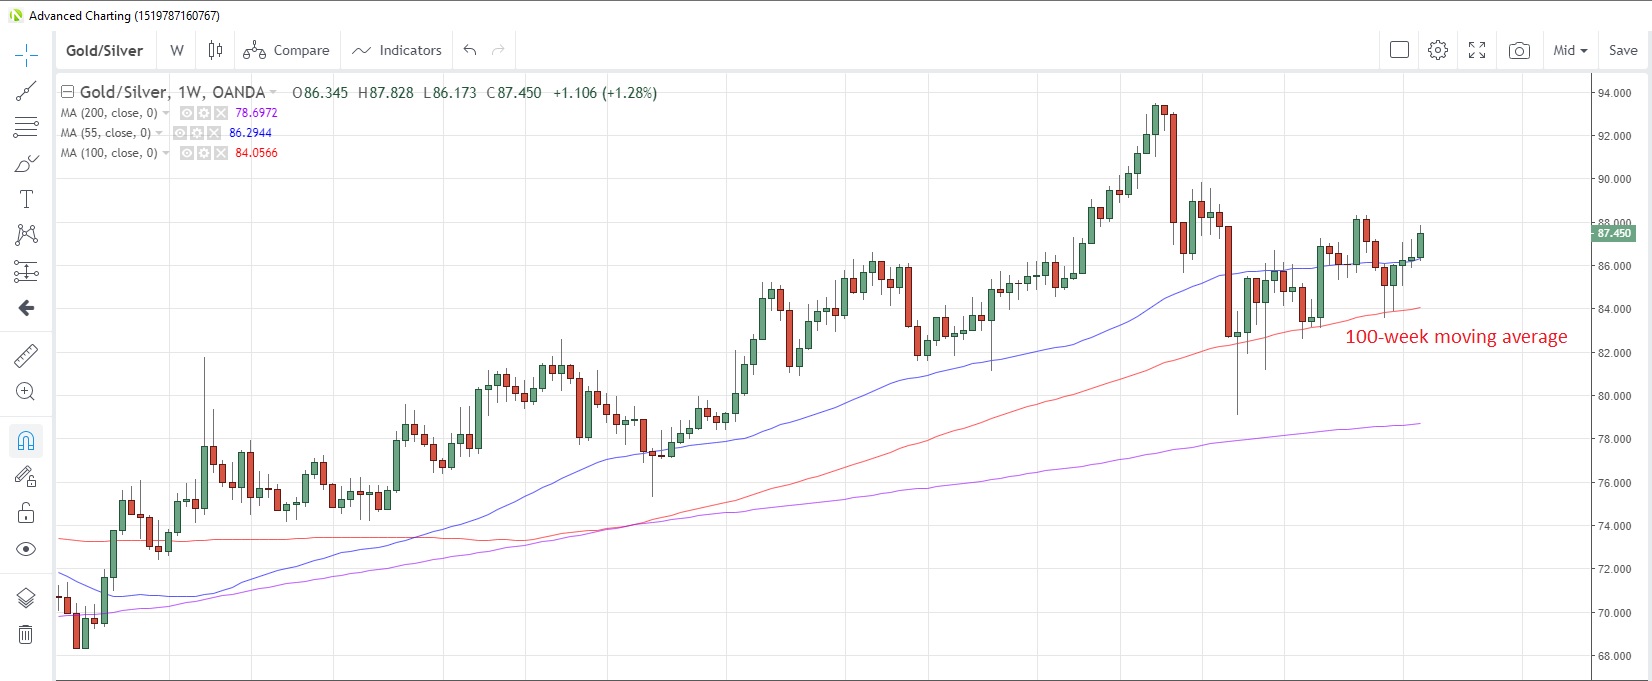
The gold/silver (Mint) ratio jumped the most since January 3 yesterday, surging above the 200-day moving average at 86.83 and closing at the highest level in six weeks. The ratio looks poised to post the biggest weekly gain in seven weeks while the 100-week moving average, which has supported prices on a closing basis since May 2017, is at 84.06.
Mint Ratio Weekly Chart

PALLADIUM fell for the first time in 20 sessions yesterday amid some profit-taking as the commodity traded above the 2,500 mark for the first time ever last Friday. However, it may be worth noting that palladium has failed to register a close above that psychological level so far.
In the run-up to the 2,500 mark, speculative investors started to offload net long positions, booking some profits after the commodity surged more than 50% last year.
PLATINUM prices fell the most in more than two weeks yesterday amid a broader malaise across the precious metals spectrum. The metal looks poised to lose ground for a third straight day today and has fallen more than 4% from last week’s near-term peak. However, speculative accounts remain at their most bullish on platinum since records began in 1993, according to the latest data snapshot from CFTC as at January 14.
Base metals
COPPER slumped the most in four months yesterday as the initial euphoria over the signing of the US-China trade trace continues to ebb. Prices reached the lowest in two weeks early this morning before staging a mild rebound.
Copper stocks as at Friday in warehouses monitored by the London Metal Exchange were at the lowest since mid-March, according to Bloomberg reports. Speculative investors turned net bullish on the industrial metal for only the fourth time since April last year in the week to January 14, according to the latest report from CFTC.
Agriculturals
SUGAR prices soared to the highest level in two years yesterday amid a continuing supply shortfall, and look set to rally for a third straight month, if current levels are maintained for the rest of January. Speculative accounts were well-positioned for the latest rally, having built up net long positions to the highest since April 2017, according to the latest data from CFTC.
Thailand’s Cane and Sugar Board has stated that output since December 1, when the current season started, has reached four million tons. Meanwhile, the Thai Millers Association has said current drought conditions, which are expected to be the worst in 40 years, could push output for this season below 100 million tons compared with 130 million tons in the last season.
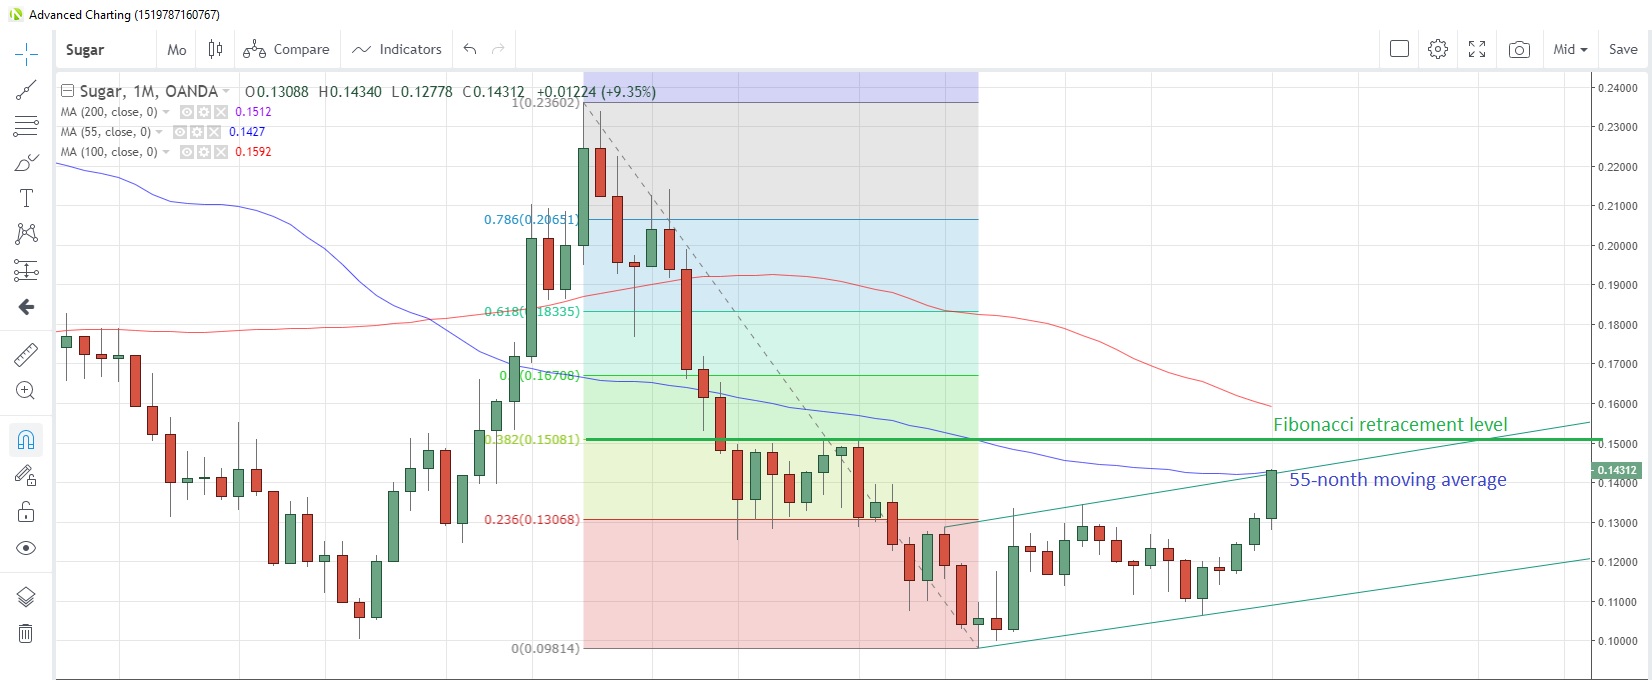
Prices are testing the 55-month moving average at 0.1427 for the first time since May 2017, while the 200-week moving average is at 0.1447. The 38.2% Fibonacci retracement of the September 2016 to August 2018 drop is at 0.1508, close to the 200-day moving average at 0.1521.
Sugar Monthly Chart

WHEAT prices have extended the recent bullish run to a fourth straight day, hitting the highest level in 4-1/2 years early this morning, while the commodity looks poised to advance for a fifth consecutive month. Speculative investors were well positioned for the recent rally, having increased net longs for a third straight week to January 14, CFTC data show.
Pakistan has said it is to import 300,000 tons of wheat in the February 15 to March 31 window in order to alleviate local price pressures, according to a statement from the country’s finance ministry.
SOYBEANS fell the most since November 11 yesterday, dropping toward the 100-day moving average at 9.0359 which hasn’t been tested since December 12. Meanwhile, the 50% retracement of the December/January rally is at 9.023.
Speculative investors increased net long positions for the fourth week in five in the week to January 14, according to CFTC data. They are now at the highest since the week of November 19.
CORN is still struggling to overcome technical resistance at the 200-day moving average. It’s at 3.8272 today and has repelled repeated attacks since mid-December, with only three closes above it, which weren’t maintained, recorded during that period. The lack of penetration of the resistance level is having an effect on speculative positioning, with investors turning net sellers for the first time in five weeks up to January 14.
