Energy
Crude Oil prices hit the highest since November 1 this morning with concerns increasing about disruptions to supplies out of Libya amid escalating civil unrest in the country. Also relating to supply, Saudi Arabia’s Energy Minister commented yesterday that markets were moving “in the right direction” and it may not be necessary for Saudi Arabia to make deeper cuts to its production output. That said, OPEC+ still sees oil inventories as too high, with an overhang of between 70 and 80 million barrels. The next key OPEC meeting will be held in May.
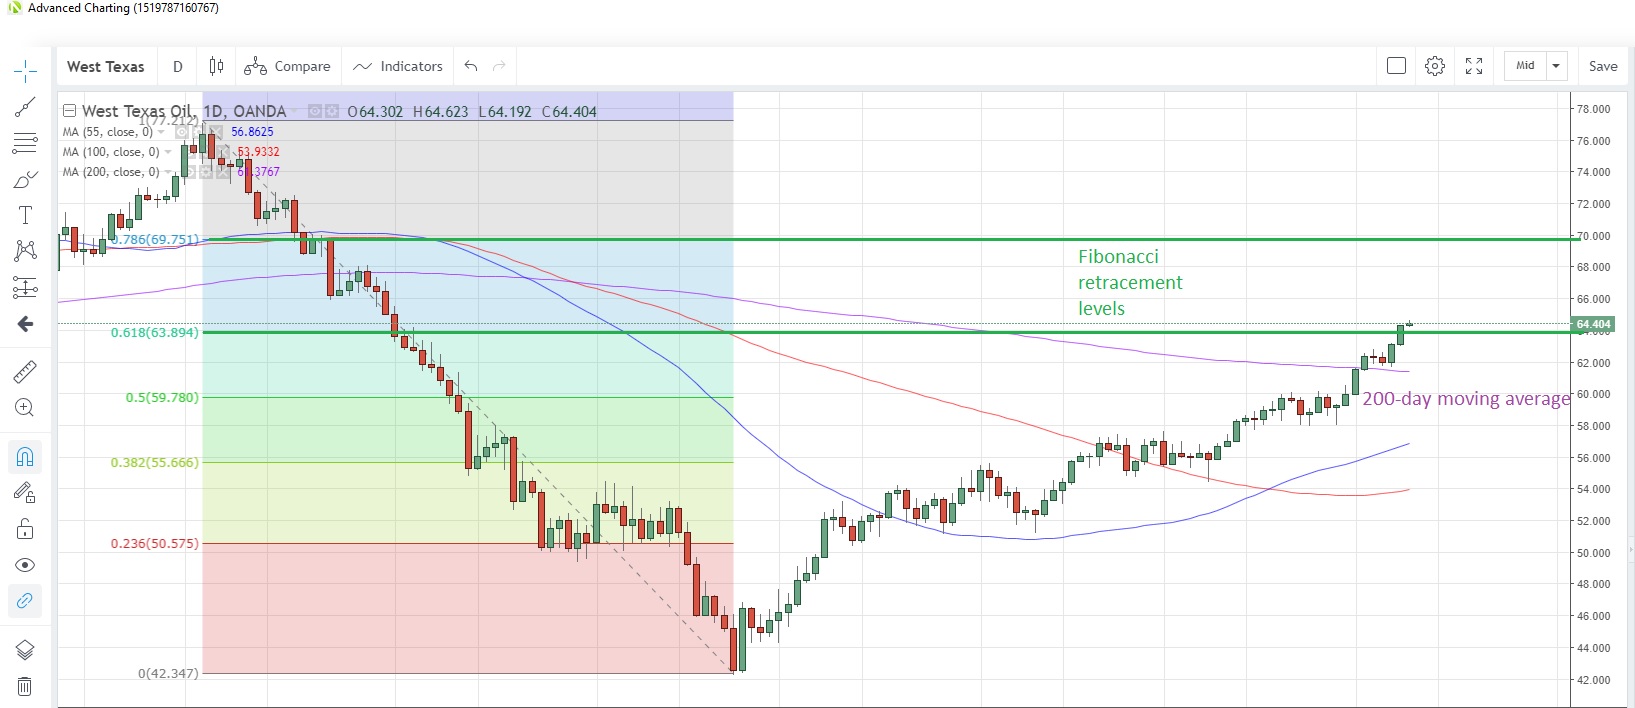
Oil prices touched $64.63 this morning after posting a 1.9% gain yesterday, the most in a week. Prices have now crossed the 61.8% Fibonacci retracement of the October-December drop at $63.768 and the 78.6% retracement of the same decline is at $69.751. The 200-day moving average at $61.377 would be the first technical support point.
WTI Daily Chart
Source: OANDA fxTrade
Natural Gas prices continue to be pegged down close to 15-month lows despite forecasts of colder-than-normal weather across most of the US. In addition, gas inventories are 30% below normal levels, increasing the risk of a spike higher should any supply issues arise. An increase in gas exports from Norway recently has pushed the UK market into surplus.
The lack of momentum in either direction has seen speculative investors trim their net short positions to the lowest since the week of February 12, according to the latest data snapshot as of April 2 from CFTC. Natural gas is now at 2.708 and is facing the 55-day moving average at 2.776, which has capped prices since December 24.
Precious metals
Gold has pivoted around the 1,300 mark for the past week, successfully defeating an attempt to break below the 100-day moving average, which is at 1,284.96 today. The inability to maintain the foothold above 1,300 consistently has seen speculative accounts turn net sellers for the first time in three weeks in the week to April 2, the latest CFTC data shows.
Data out of China has shown that the nation extended its recent gold buying spree, buying 360,000 ounces of the precious metal in March as prices rose as much as 0.9% on the month before closing 1.6% lower. Meanwhile, data released by the Russian central bank shows it added one million ounces of gold to its reserves in February, the most since November 2018.
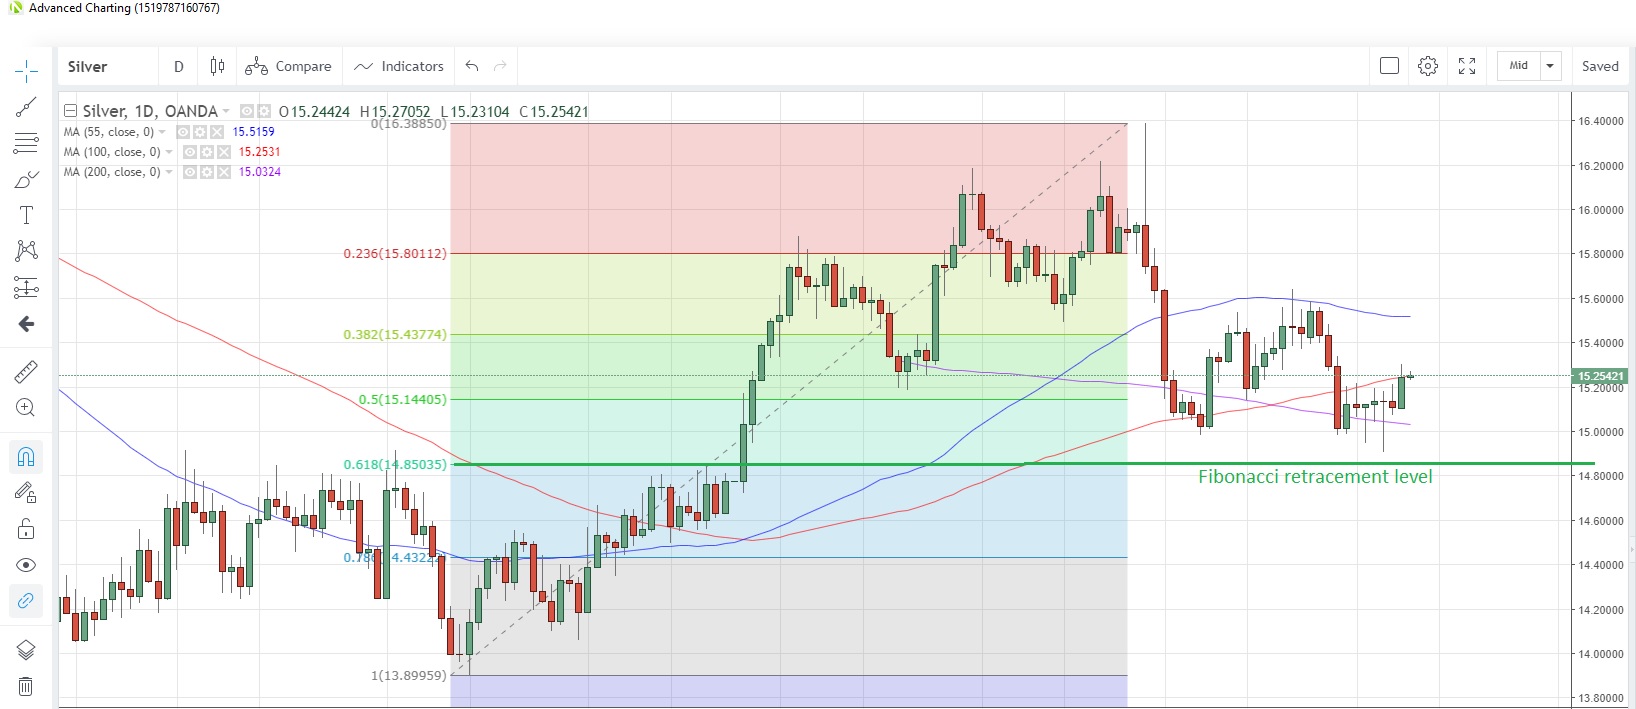
Silver fell to the lowest level this year last week as it echoed the slippage in gold. The metal is attempting a rebound from the 15-week lows this week amid signs of broader weakness in the U.S. dollar. The decline stalled just ahead of the 61.8% Fibonacci retracement of the November to February rally at 14.850. The decline forced many speculative longs positions to be scaled back, with investors reducing net longs to the lowest since the week of December 11, according to CFTC data. The gold/silver (Mint) ratio has been steady in an 85.00-86.00 range for the past two weeks.
Silver Daily Chart
Source: OANDA fxTrade
Platinum posted its biggest weekly advance in more than two years last week amid supply concerns, as reports suggest South African mines are facing potential strike action. In addition, the wide price differential between platinum and palladium has raised expectations for greater demand for platinum for use in catalytic converters in cars. Speculative investors turned net sellers in the week to April 2 for the first time in three weeks, according to CFTC data.
Palladium has been consolidating the dramatic drop from above 1,600 two weeks ago, and is currently hovering above the 100-day moving average at 1,367. This average has supported prices on a closing basis since August 28 last year. The price collapse has forced speculative investors to ditch bullish positions, and they were net sellers for the sixth straight week in the week to April 2, CFTC data shows. That’s the longest selling spree since March/April last year.
Base metals
Copper remains in consolidation mode, retreating slowly from the nine-month highs struck last week. The industrial metal touched 2.9809 on April 1, the highest since June 27. Speculative accounts turned net buyers for the first time in four weeks, CFTC data to April 2 shows, while a weekly survey of traders has shown participants becoming less bearish on the metal amid reports of progress in the US-China trade talks.
There was some good news on the supply side as production at Peru’s second-largest mine is set to get back to normal after negotiators reached an agreement with locals to lift a mine blockade that had been in place for about two months.
Agriculture
Speculative investors turned most bearish on Corn since November 2017, the latest data snapshot as at April 2 from CFTC shows. Prices are still attempting to recover some of the steep losses suffered on March 29 after the US Department of Agriculture’s (USDA) report suggested that US acreage and stockpiles were set to increase.
Meanwhile, another USDA report saw corn imports by Bangladesh picking up in the next season starting July, amid a rising population and an expanding poultry industry. Corn is now at 3.544 with the 200-day moving average sitting above at 3.588.
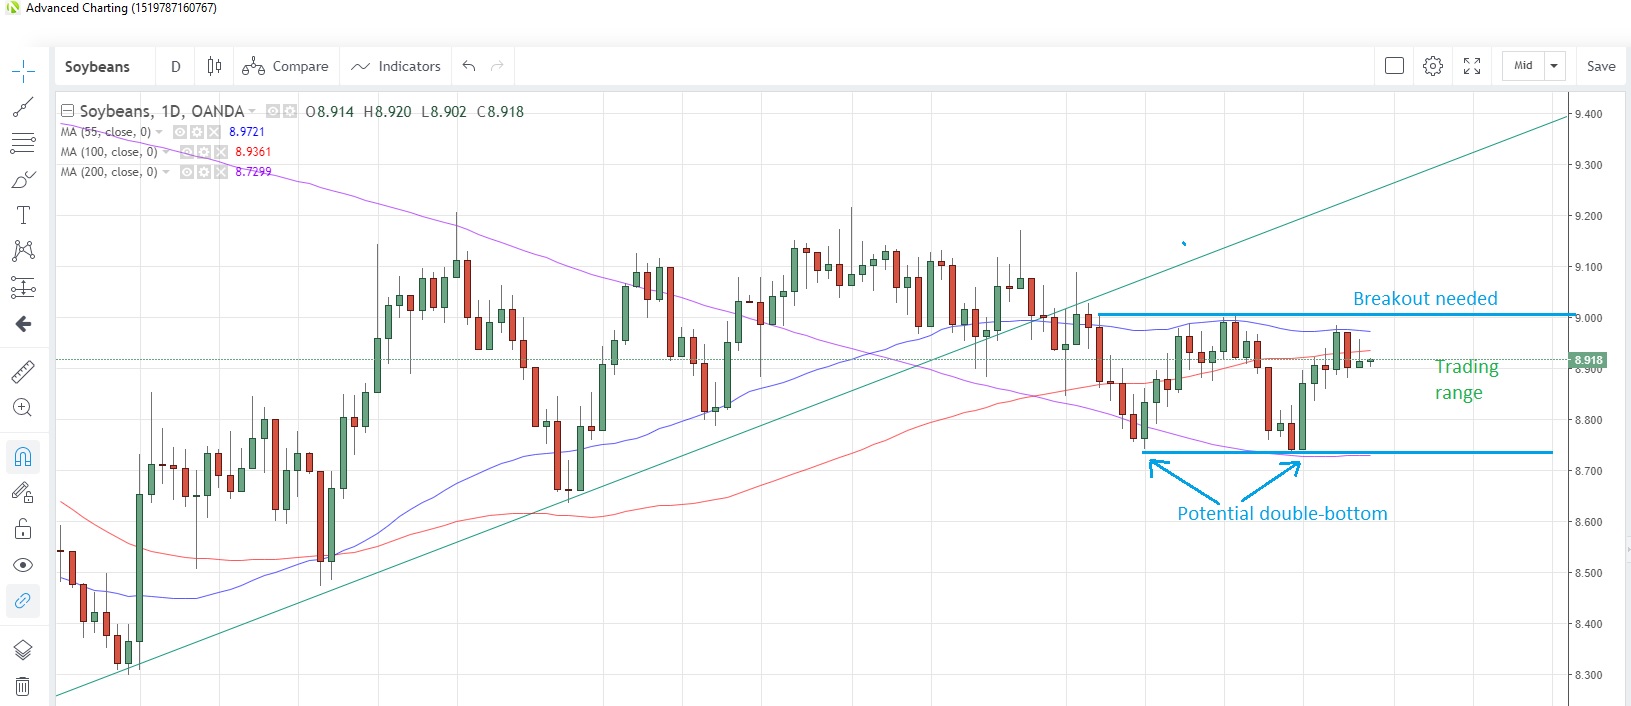
Soybeans recorded the biggest weekly gain of the year last week amid hopes that a US-China trade deal would soon be concluded. The commodity has been trading in an 8.73 – 9.00 range since early March and a sustained break above 9.00 would be needed to confirm a double-bottom chart pattern is in place from the lows on March 12 and 29. Speculative investors turned net sellers for the first time in three weeks up to April 2, according to CFTC data.
Soybeans Daily Chart
Source: OANDA fxTrade
Wheat looks on track for a third daily decline in a row amid concerns about oversupply. India tabled plans to offload excess wheat in the open market ahead of the normal schedule during the current season ending in June. Normally it sells excess inventories after the procurement exercise, but this time it will sell in the market immediately because warehouse stockpiles are nearly at capacity.
Speculative investors were net sellers for a fourth straight week in the time to April 2, reducing net long positions to the lowest since the week of February 19. Wheat is now at 4.564 with the falling 55-day moving average at 4.755 chasing prices lower. Wheat has traded below this moving average since February 14.
Sugar has stuck to a narrow trading range over the past week and managed to hold above the 100-day moving average. This average has supported prices on a closing basis since March 11. It’s now at 0.1242 with sugar trading at 0.1261. Speculative accounts reduced net short positions for a third consecutive week.


