NOTE: CFTC will be updating the weekly Commitment of Traders report twice a week, Friday and Tuesday, until the data becomes current.
Base metals
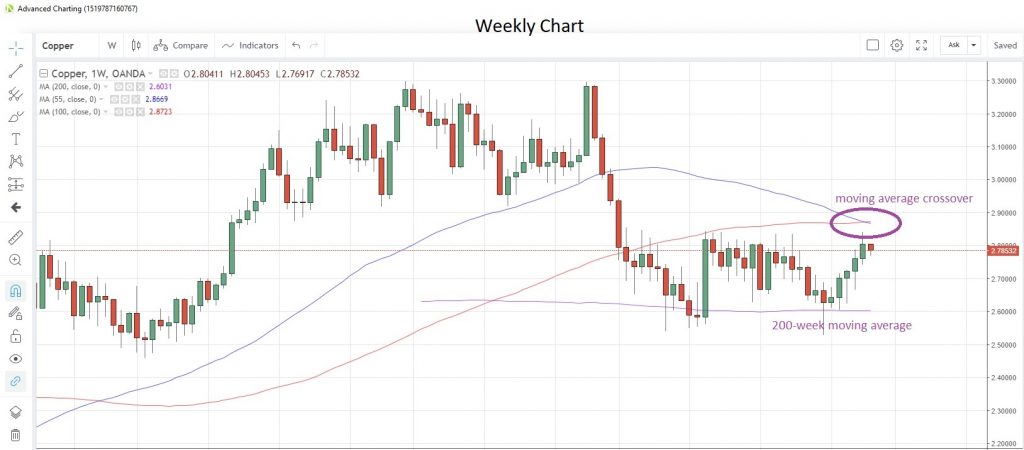
The uncertainty surrounding the next stage of U.S.-China trade talks at the end of this week, with the March 1 deadline fast approaching, has kept copper prices under pressure for the last few sessions. Prices had reached a 4-1/2 month high late last week, but once again failed to breach resistance around the 2.8420 level. If the pressure continues for the rest of the week, copper faces its first weekly loss in six weeks. The 55-week moving average at 2.8668 looks poised to close below the 100-week moving average at 2.8723 for the first time since March 2017.
Copper Weekly Chart

Speculative investors increased their short copper positions to their highest since the week of Sept. 13, 2016, according to the most recent data from CFTC as at Jan. 8.
Precious metals
Gold continues its retreat from 9-1/2 month highs as the U.S. dollar recaptures some of its safe haven status. Gold is still holding above the key 1,300 level, a level which proved to be a tough level to crack on the way up in January. It will now act as strong support. Gold is now trading at 1,308.25. Latest data from CFTC showed that speculative investors turned net sellers for the first time in six weeks in the week to Jan. 8.
India’s gold imports jumped 64% from a year earlier in January, despite local gold prices hitting their highest in more than five years, Bloomberg reports. The jump comes ahead of the popular wedding season, which runs from February to May.
IMF data shows that Kazakhstan increased its gold holdings by 2.81 million tonnes in January while central bank data showed China added 380,000 troy ounces to its reserves in the same month. Meanwhile, Italy is proposing a change to its constitution that will allow the government to sell the country’s gold reserves.
Silver has fallen 2.3% since the beginning of the month as the U.S. dollar remains buoyant. The metal had touched a six-month high at the end of last month. Speculative accounts seem convinced the up-move has more legs as latest CFTC data as of Jan. 8 shows net long positioning at its highest since November 2017.
ETF holdings of platinum reached 2.61 million ounces last week, the highest since November 2015, according to data compiled by Bloomberg. However, speculative accounts reduced their net long holdings for the first time in four weeks in the week to Jan. 8, according to CFTC data.
Palladium remains in consolidation after hitting record highs in January, still supported by the metrics of strong demand and limited supply. Palladium is now trading at 1,388.85 after hitting 1,440 in January. Speculative investors are still bullish, net buyers for a second straight week to Jan. 8 with net long positioning near 11-month highs, according to the latest CFTC data.
Energy
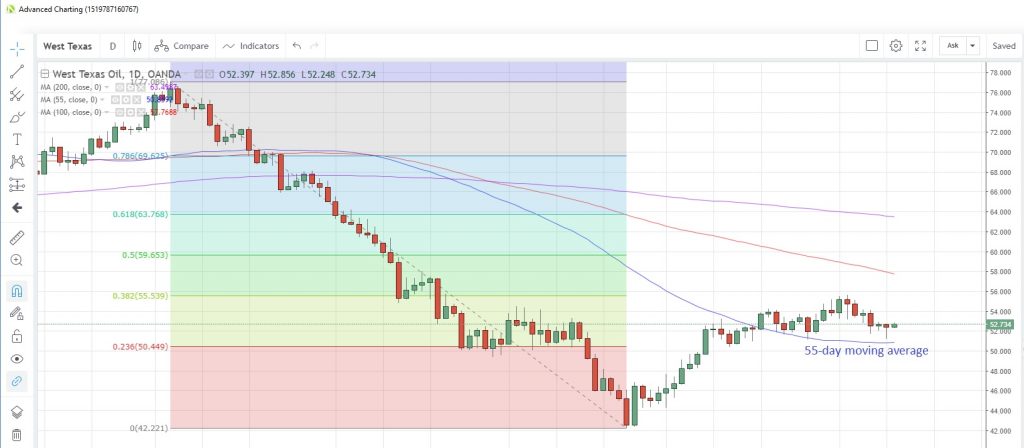
Last week crude oil suffered its worst weekly loss this year, and struggled in the early part of yesterday amid concerns about the U.S.-China trade talks at the end of this week. WTI fell as much as 2.8% to a two-week low of $51.17 per barrel before rebounding strongly into the close, as OPEC cuts and Venezuela sanctions overcame the selling pressure. WTI held above the 55-day moving average at $50.855, as it has on a closing basis since Jan. 17. Later today API releases weekly crude oil inventory data, which has shown an increase in oil stockpiles for the past three weeks.
WTI Daily Chart

Natural gas is hovering near 14-month lows despite unseasonably cold weather across most of the U.S. pushing up demand. The extended cold snap has seen a reduction in stockpiles for the past eleven weeks, according to EIA data released on Feb. 7.
Natural Gas Weekly Stockpiles Data

Agriculturals
In its shutdown-delayed World Agricultural Supply and Demand Estimates (WASDE) report last Friday, the U.S. Department of Agriculture raised its outlook for wheat reserves while keeping the exports forecast unchanged for the current season. Russian exports are seen slowing as domestic prices rise, making Russian wheat less competitive. Meanwhile, Egypt, the world’s biggest wheat importer, bought two consignments of U.S. wheat last Friday, the first time it had done so since November.
Prices were at the month’s lows when the report was published, and have since staged a mild recovery, holding above the confluence of three moving averages, the 55, 200 and 100 averages, in the 5.0748-5.0324 window. Prices are now at 5.144.
Sugar looks poised for its third daily loss in a row despite some possible supply disruptions in the future. Australian sugar cane producers in Northern Queensland are hoping that heavy flooding that has devastated thousands of hectares in the growing region will not hurt the crop harvest too much.
Non-commercial net short positioning in sugar increased for a fourth straight week in the week to Jan. 8, and is now at the most since the week of Oct. 3, according to delayed CFTC data.
Argentina’s corn harvest for the current season is seen at a record level of 46 million tons, an 8% increase from the previous season, as abundant rains and benign temperatures boost crop yields. Corn prices have fallen for the past four days, though this could stop today as the 55-day moving average at 3.6917 holds on a closing basis. Corn is now at 3.702.
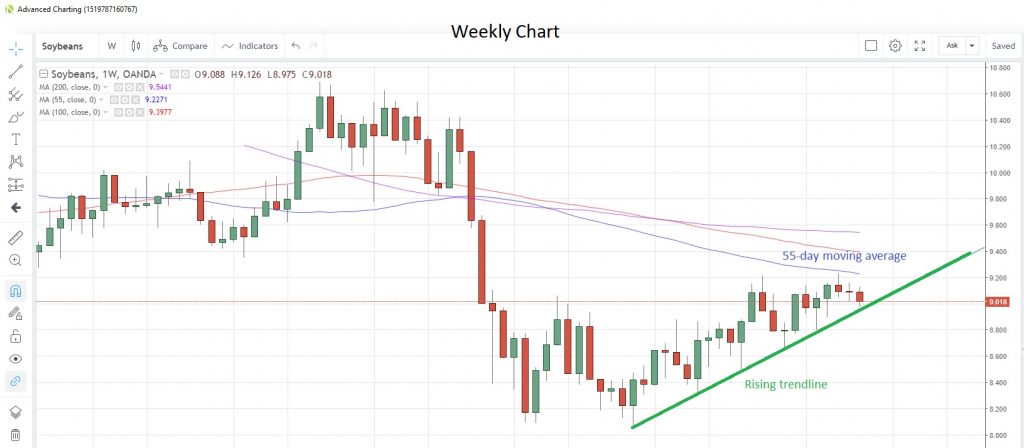
Soybeans are facing a third weekly loss after the USDA trimmed its outlook for China soybean demand in its latest WASDE report published last Friday. There is rising trendline support from the September low on the weekly chart, which comes in at 8.946 this week, while the 55-week moving average at 9.2272 acts as interim resistance.
Soybeans Weekly Chart

