The rush for safe haven assets as Trump ramps up the trade war tariffs continues, to the benefit of precious metals, while a persistently inverted US yield curve threatens the growth outlook. Oil prices surge as inventories tumble, while the agricultural sector faces issues from oversupply and tariff-threatened demand.
Precious metals
Concerns about the on-off trade war between the US and China has kept GOLD elevated this week as investors seek safe haven assets. The yellow metal hit 1,556 on Monday, the highest level since April 2013, and is facing its best monthly gain since January 2012. Gold has been pushed around for the rest of this week as US President Trump flip-flops on his negotiating approach to China. The latest news suggests China is still willing to sit at the negotiating table for “calm” talks, so gold has eased back a tad from Monday’s high. It’s now trading at 1,542.60.
Speculative investors were well positioned for the latest surge, having boosted net long positions to the highest since September 2016, according to the latest data snapshot from CFTC as at August 20. In a recent client research note, Swiss bank UBS forecast that gold could reach 1,600 in the next three months. Meanwhile, China gold imports via Hong Kong plunged to an eight-year low last month.
SILVER is also enjoying a buying spree amid steady demand for precious metals. The metal is poised for its best month since June 2016 and looks set to cement its foothold above the 55-month moving average, which is at 16.278 today.
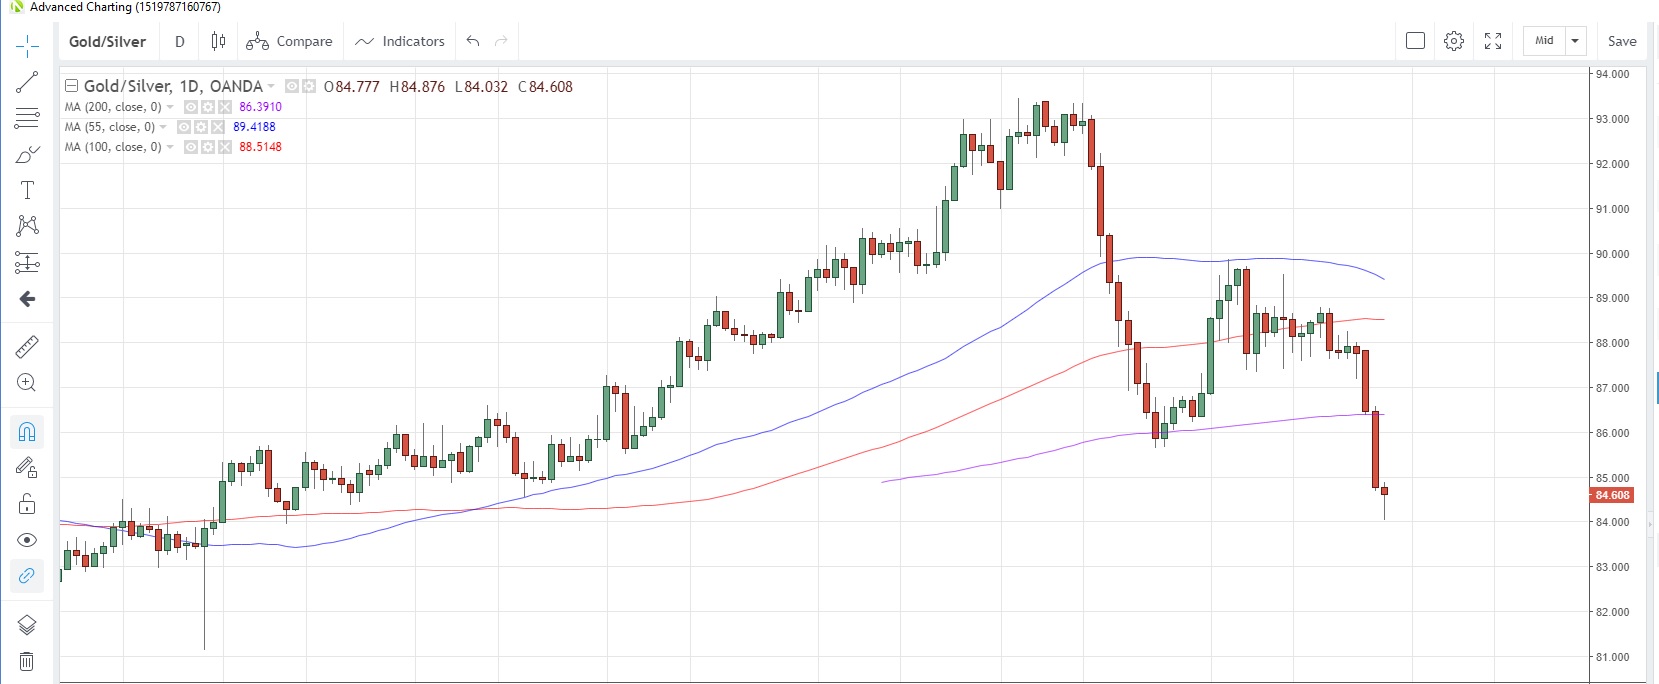
In the latest trading session, exchange-traded funds (ETFs) added 2.17 million troy ounces of silver to their physical holdings, according to a report by Bloomberg yesterday. In contrast, they offloaded a net 23,000 troy ounces of gold as the gold/silver (Mint) ratio slumped to the lowest level since March 12. Speculative investors halted a two-week selling spree of silver, according to the latest data from CFTC as at August 20.
Gold/Silver Daily Chart

PLATINUM is facing its second weekly gain in a row and is testing the 100-week moving average at 871.08. That moving average has capped gains on a closing basis since the week of April 22. Speculative investors continued to trim their net long positions in the week to August 20, the latest data from CFTC show.
PALLADIUM is also enjoying a strong run amid steady demand for precious metals. It’s on track for a fourth consecutive weekly advance and touched the highest since August 1 last week. The 55-day moving average at 1,501.82 remains a tough resistance point however, having capped gains on a closing basis since the start of the month.
Base metals
COPPER hit the lowest level since May 2017 on Monday after US President Trump dealt his latest blow to US-China trade negotiations by announcing an additional 5% on all levies on Chinese imports from September 1. A slight flip-flop on his approach to China at the start of this week has helped copper regain come lost ground and it is now trading at 2.5544, up 0.3% from Monday’s low. Speculative accounts were net buyers of the industrial metal for a second straight week in the week to August 20, such that net short positions are at the lowest since end-July, the data from CFTC show.
Energy
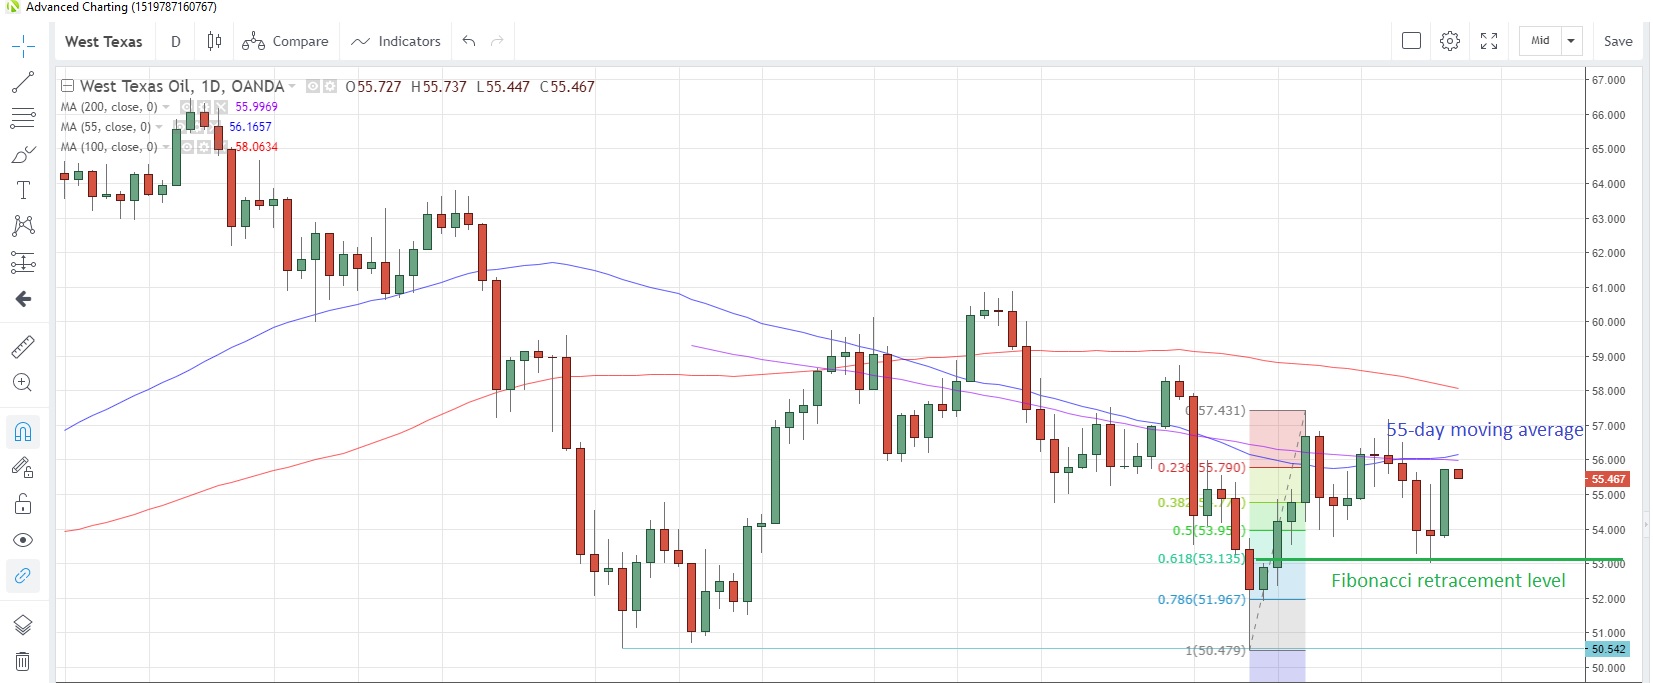
CRUDE OIL prices surged yesterday, bringing a four-day decline to a halt, as West Texas Intermediate (WTI) posted the biggest one-day gain in two weeks after the American Petroleum Institute announced the biggest weekly drawdown of inventories since January 2018. Inventories were cut by 11.1 million barrels, a sharp increase from the previous week’s loss of 3.5 million barrels.
The data seems to confirm a statement by OPEC and its allies yesterday, before the data, which said they expected a “significant” drawdown on reserves as producers try to control supply by sticking to production targets, even in some cases cutting back more than expected quotas.
Speculative investors increased their net long positions for a second consecutive week in the week to August 20, according to CFTC data.
WTI Daily Chart

NATURAL GAS has been confined to a relatively tight 2.12-2.27 range for the past two weeks and still remains camped below the 55-day moving average, which has capped prices since July 15. Traders are unsure how to interpret conflicting weather reports from across the US. Reports of milder temperatures across the north east and mid-west are countered by forecasts of hotter readings in the west. EIA natural gas storage data as at August 23, which will be released Thursday, is expected to show an addition of 60 billion cubic feet (bcf), slightly more than the previous week’s 59 billion increase.
Agriculturals
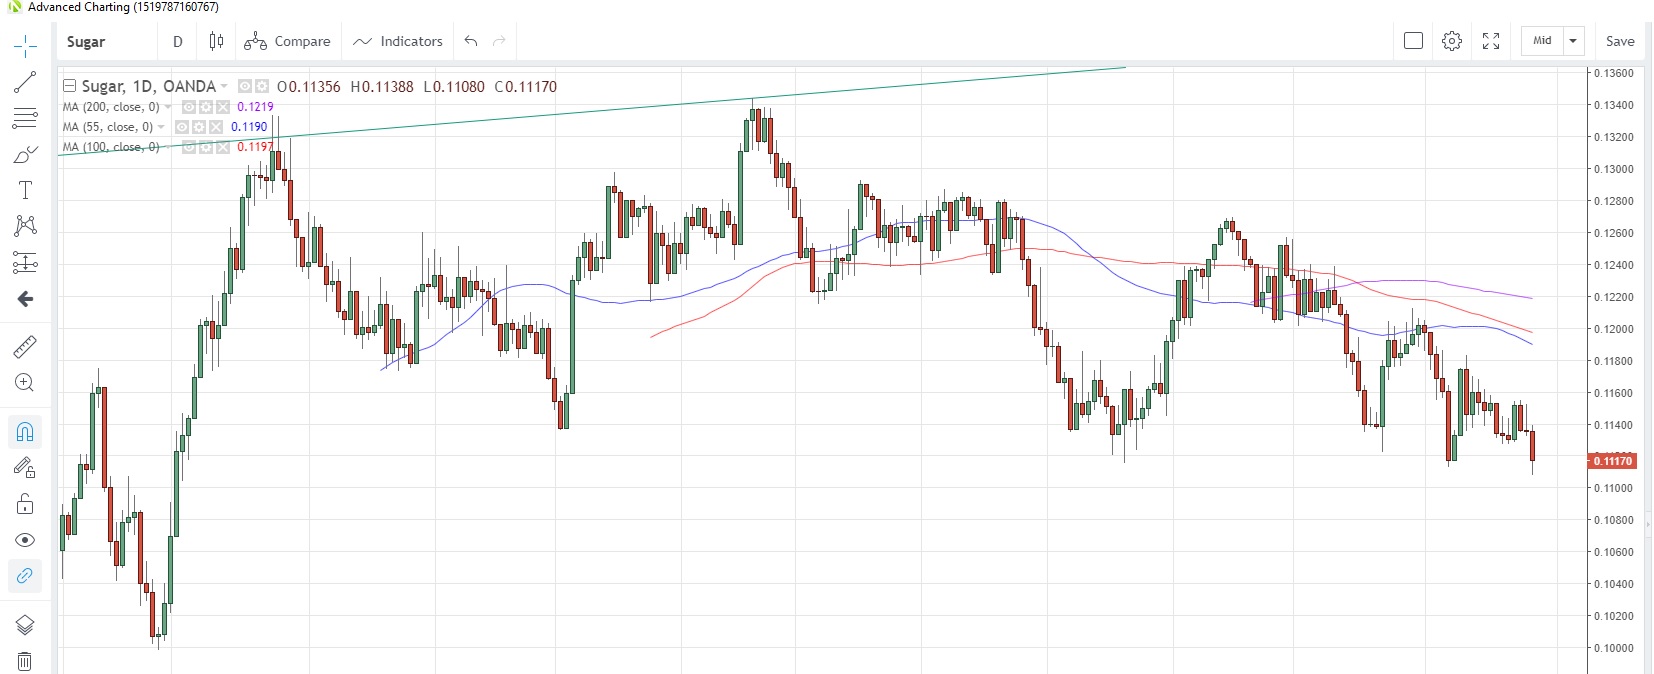
SUGAR hit its weakest level since October last year yesterday as the markets continue to suffer from a global oversupply. It’s facing its biggest monthly drop since July 2018, which comes as the latest estimates from the US Department of Agriculture suggest that India’s sugar crop would be above 30 million tons for the third season in a row, with next season’s harvest seen even bigger.
Meanwhile Dutch bank Rabobank has predicted that Mexico could flood the international market with excess sugar since the latest trade deal with the US limits the amount of sugar the US will import from them.
Sugar Daily Chart

CORN has been hovering near 3-1/2 month lows for the past two weeks amid the uncertain outlook for US-China trade negotiations. China customs data has shown that China’s corn imports rose 16.5% to 386,000 tons in July. Meanwhile, speculative investors trimmed net long positions for a fifth straight week in the week to August 20 and they are now at the least since the week of May 21.
SOYBEANS received a lift at the start of this week, pulling prices off three-week lows, after US President Trump said the China “very badly” wants to do a trade deal. Since then, prices have gradually drifted lower since there has been little in the way of acknowledgement from China that this is the case. China’s imports of soybeans rose 8.4% in July, according to the latest data from China’s customs bureau.
WHEAT has seen choppy price action this week amid the muddled outlook for US-China trade negotiations. Speculative accounts scaled back net long positions for a third straight week, according to the latest data from CFTC.
