Growing tensions in the global trade war and a broader risk-off mood across asset classes boosted gold’s safe-haven appeal and powered the precious metal to its highest level in more than six years. The agricultural and energy sectors are feeling pressure from the escalation in the US-China trade war.
Precious metals
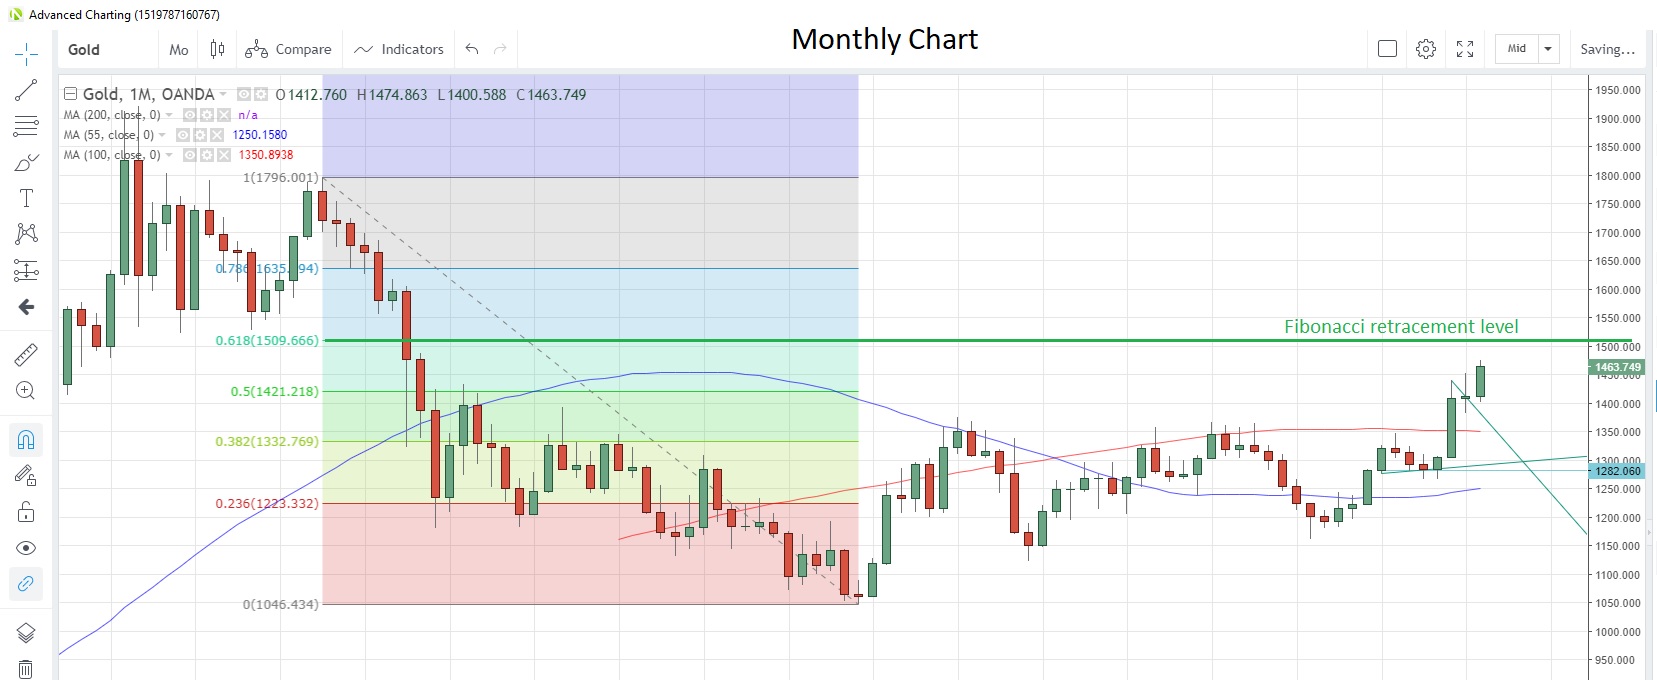
GOLD prices surged to the highest since May 2013 this morning as investors sought safe-haven assets amid a sudden escalation in US-China trade friction. Gold has risen as much as 15% since the start of the year, and the next possible technical resistance point could be the 61.8% Fibonacci retracement of the drop from October 2012 to December 2015 at 1,509.67.
Gold Monthly Chart

Speculative investors were correctly positioned for the latest up-move, having increased net long positions for a third straight week in the week to July 30, the latest data snapshot from CFTC shows, while exchange-traded funds (ETFs) added to holdings for a fifth consecutive day, Bloomberg reported yesterday. Total gold holdings by ETFs have risen by almost 7% this year.
India’s gold imports probably fell 69% in July compared with a year earlier as consumers were faced with a hike in the gold import tax in the month, according to provisional figures from the Finance Ministry cited by Bloomberg.
SILVER is hovering near 13-month highs, riding on the coattails of gold’s climb but tempered a little by demand concerns from the industrial sector if the trade war escalates further. Speculative investors were net buyers of silver for a third straight week to July 30, boosting net long positions to the highest since November 2017, CFTC data show.
PALLADIUM is struggling to find a safe footing despite strength in other precious metals. The metal slid to the lowest since June 11 on Friday but has managed to hold above the 200-day moving average at 1,375.
US exports of palladium fell almost 5.5% in June from the previous month to just above six million grams, according to the US Commerce Department. Holdings of the metal by ETFs fell for a 13th consecutive day, Bloomberg reported yesterday, though speculative investors remain cautiously bullish on palladium, with the latest data from CFTC showing and increase in net long positions for a second week.
PLATINUM fell for the first time in four weeks last week and has been consolidating those losses so far this week. The metal failed to close above the 100-week moving average at 873.40 for a second week running and has not closed above it since April. Speculative accounts were net buyers of the commodity for a third week to July 30, lifting net long positions to the most since the week of May 7.
Base metals
COPPER tumbled the most this year last week as the trade tensions between the US and China increased. The industrial metal hit a seven-month low yesterday amid concerns for the global growth outlook and demand as the trade war deteriorated. Additional pressure came from weaker factory activity readings from Asia, Europe and the US in July. A slackening in demand is evidenced by growing stocks of copper at warehouses monitored by the London Metal Exchange. They have been climbing steadily since July 29.
Speculative investors brought a two-week profit-taking buying spree to a halt in the week to July 30, instead adding to overall net short positions, the latest data from CFTC show.
Energy
CRUDE OIL prices have been consolidating last Thursday’s drop, the largest one-day drop in four years, and are holding above the 200-week moving average at $52.88, as they have on a closing basis since January. Trump’s tariffs and their threat to global trade appear to be overshadowing events in the Gulf, where another tanker was reportedly seized by Iran in the Straits of Hormuz, though no details on ownership have been released.
On the supply side, the number of US rigs in production fell for a fifth week to August 2, and are now at the lowest since February 2018. Russia’s Energy Ministry has said it aims to stick to the OPEC+ production targets in August. Meanwhile, Saudi Arabia has cut prices of all crudes to Asia for delivery in September.
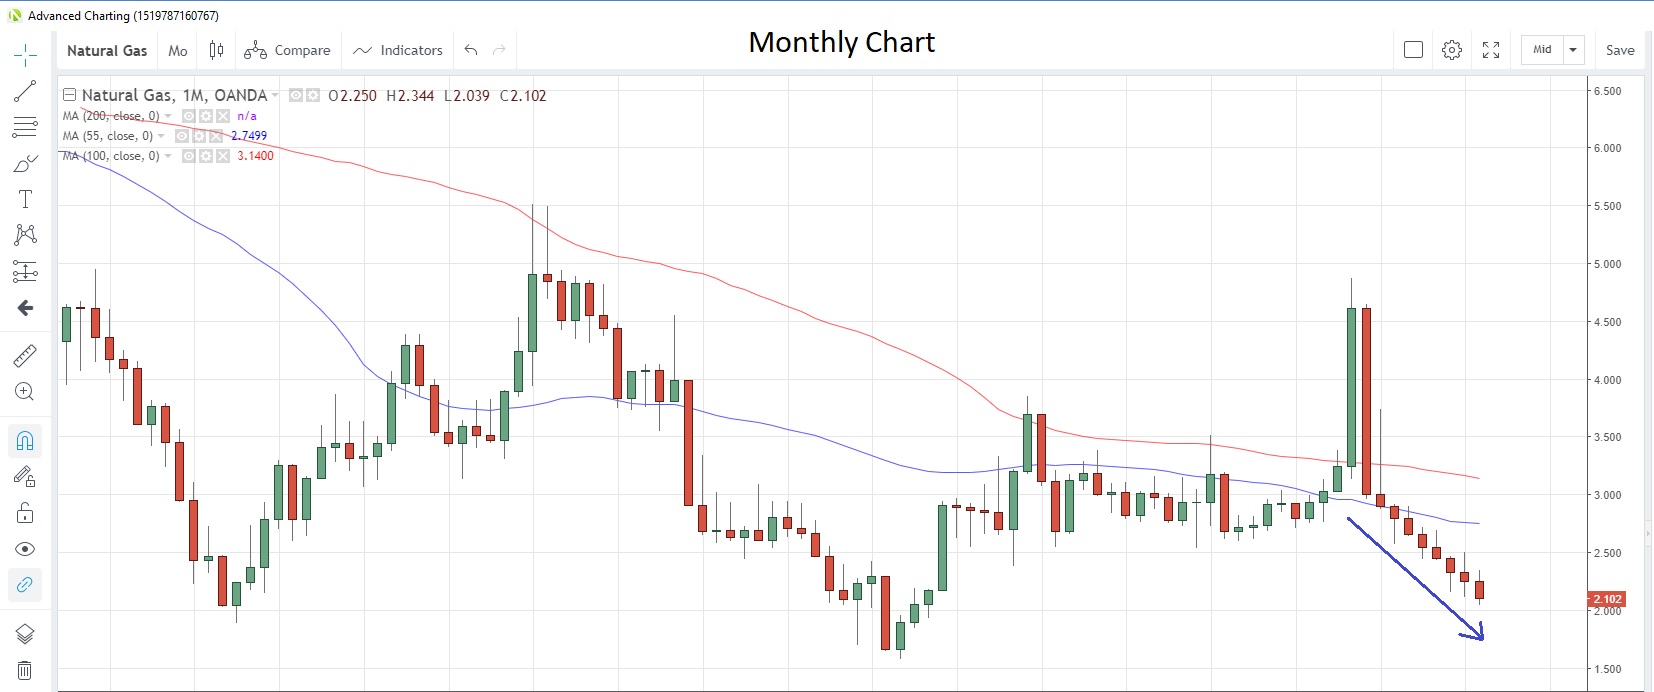
NATURAL GAS prices slumped to a 39-month low yesterday with global output at a seasonal record high just as demand is seen slowing due to cooler weather expected in Northeast US in the August 10-14 period. The commodity looks on track for a fourth consecutive weekly loss and could extend the recent bear run to a ninth month.
Natural Gas Monthly Chart

Data from the EIA showed an increase in stockpiles of 65 billion cubic feet (bcf) in the week to July 26, more than the 57bcf forecast and above the five-year moving average of 37bcf. Non-commercial traders increased their net short positions for a second consecutive week, boosting them to the highest since March 2016.
Agriculturals
WHEAT prices are on the rebound from 2-1/2 month lows this week after touching the lowest level since May 24 on Thursday after US President threatened additional tariffs on Chinese imports. In an escalation of hostilities, China reportedly asked state buyers yesterday to stop purchases of US agricultural products. It’s worth noting that global supplies of wheat are still plentiful so China should have no problem sourcing requirements from elsewhere. Prices for Brazilian wheat have risen since the US-China friction increased.
Speculative investors turned net buyers of the commodity for the first time in four weeks in the week to July 30, CFTC data show.
SUGAR prices fell for the third straight day yesterday, sliding to the lowest level in two weeks. In the week to July 30, speculative investors turned net buyers for the first time in three weeks as prices rebounded from two-month lows.
An industry report released last Friday forecast the 2019/20 global sugar shortage would hit 3.8 million tons, more than double a previous estimate and would completely negate the 3.8 million ton surplus seen in 2018/19.
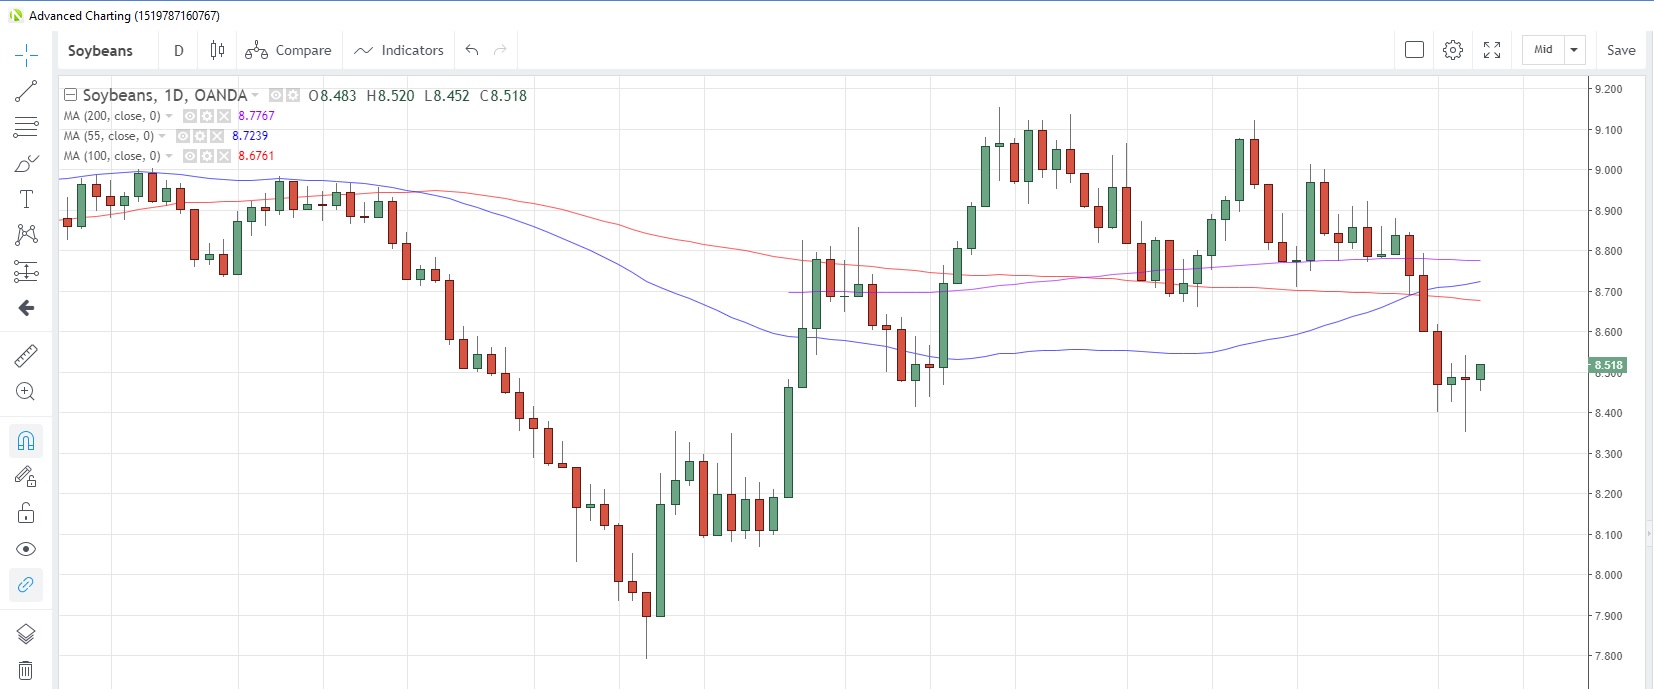
SOYBEANS fell the most in twelve weeks last week after Trump’s tariff threat. Prices touched a two-month low yesterday and have traded positively so far today. Non-commercial traders turned net sellers for the first time in three weeks in the week to July 30, with net short positions now at the highest since the week of June 11, according to CFTC data.
Soybeans Daily Chart

CORN prices are attempting a rebound from 2-1/2 month lows struck last Thursday, facing the third up-day in a row, a stretch that was last seen almost four weeks ago. Speculative accounts trimmed net long positioning to the lowest since the week of June 11, according to CFTC data to July 30.
