Precious metals
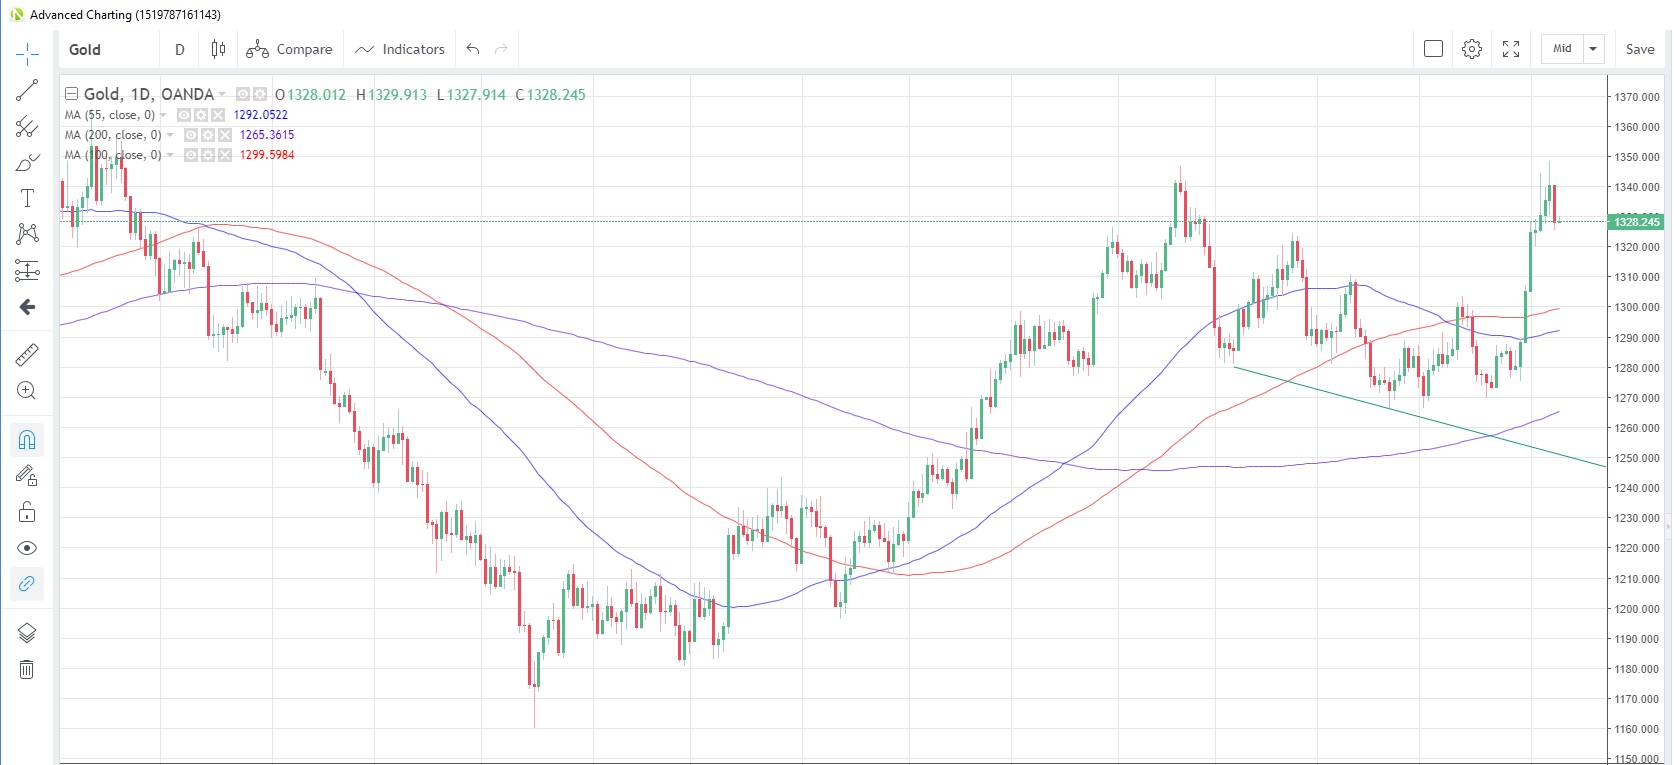
Gold prices touched the highest since April 2018 last Friday, completing the best weekly advance in more than three years. Safe haven buying amid growth concerns and central bank buying for reserves diversification helped sentiment. Buying reversed yesterday after Trump announced a suspension of Mexico tariffs.
The ongoing U.S.-China tariff war is raising concerns about the path of future global growth while data out of China showed that it increased its gold reserves for a sixth consecutive month in May. The reserves now stand at 1,916 tonnes, according to a Financial Times report.
Speculative investors remain convinced that further gains are possible as they boosted net long positions to the highest since April last year, according to the latest data snapshot as at June 4 from CFTC.
Gold Daily Chart
Source: OANDA fxTrade
Silver suffered the biggest one-day decline since March 1 yesterday as risk appetite was given a leg up by Trump’s Mexico tariff announcement. The gold/silver (Mint) ratio touched a record high of 90.56 yesterday.
More recently, speculative investors had been encouraged by silver’s rebound from this year’s lows and turned net buyers in the latest reporting week to June 4. That was the first time in five weeks they shifted to net buyers, but overall they are still positioned net short.
Platinum advanced for the first time in seven weeks last week, halting a slide that had seen the commodity fall as much as 13.8% from its April peak. The bounce is seen more corrective in nature, since the global car market is still in the doldrums, reducing demand for the metal in catalytic converters. The recent weakness has seen speculative investors trimming net long positions for five consecutive weeks, and they are now at the lowest since the week of Feb. 19.
Palladium closed above the 55-day moving average for the first time since March 26 yesterday as the metal extended its recent rebound to a third day. Speculative accounts remain bullish on the commodity, increasing net long positions for a third week in the week to June 4, the latest data from CFTC shows.
Base metals
Rising hopes that the U.S. and China will edge toward a trade deal before the G-20 summit at the end of this month have helped copper rebound from five-month lows this week. Copper prices touched the lowest since January 4 last Friday, but are now 2.7% higher at 2.6647.
The latest customs data out of China showed that copper imports in May totaled 361,000 tons, 23% lower than a year ago. Meanwhile, Chile reported that its exports were 11% higher in dollar terms from April at $3.1 billion.
In the week to June 4, speculative investors were net sellers for a seventh straight week and they increased their net short positions to the most since the week of January 15, the latest CFTC data shows.
Energy
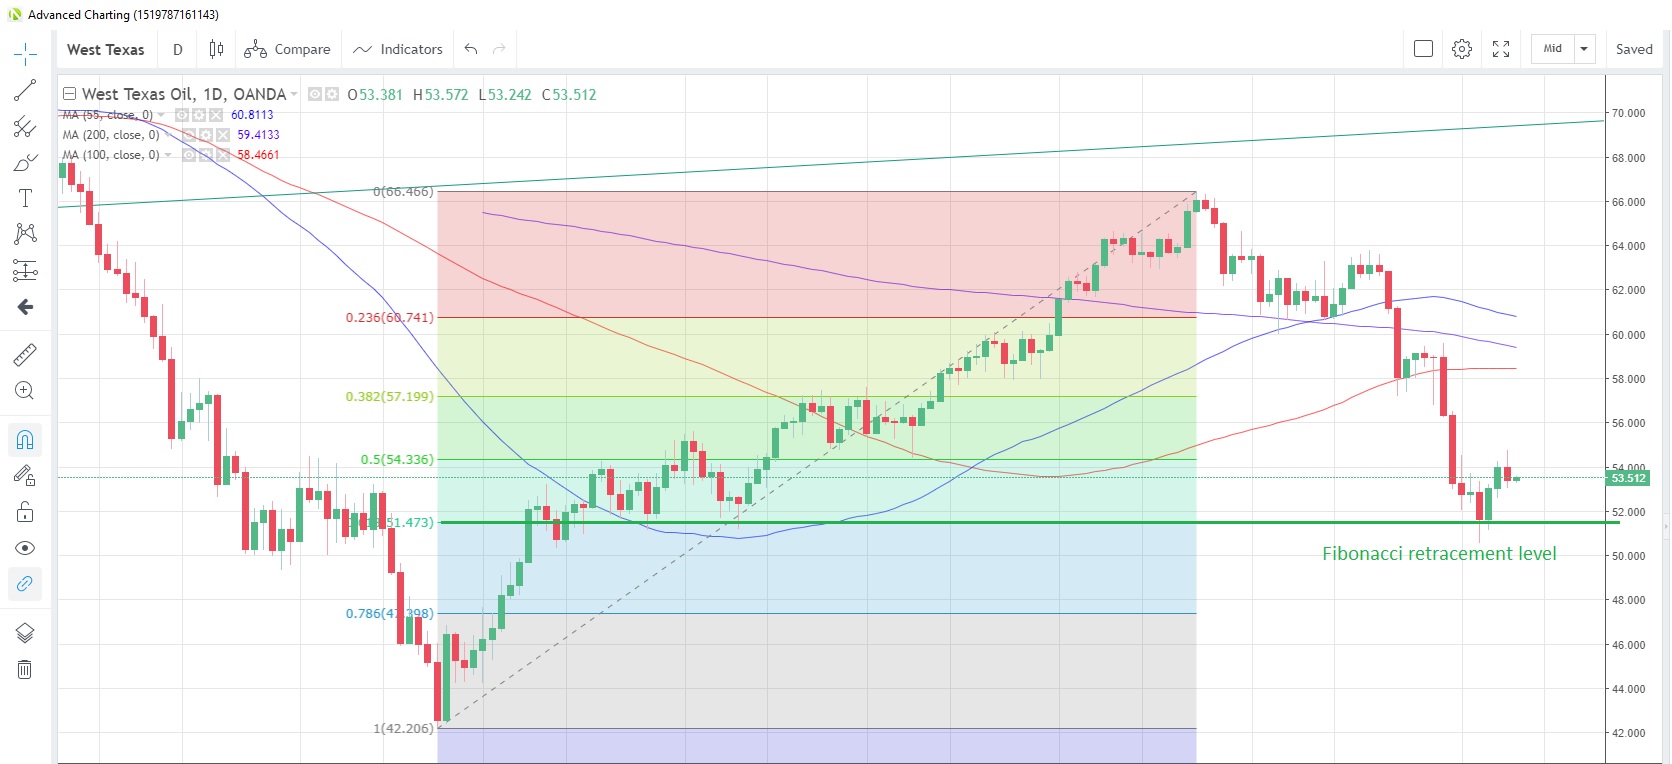
Saudi Arabia and Russia voiced concerns yesterday that falling crude oil demand could push prices below $40 per barrel. Saudi Arabia’s energy minister said that OPEC is almost unanimous on extending production cuts, possibly to the end of the year, though Russia is reportedly holding back on a final agreement, even though Russia’s energy minister warned of oversupply yesterday.
Latest customs data from China showed crude oil imports were down 8% month-on-month in May, while Friday’s data showed the number of U.S. oil rigs in production fell for a fourth week in five as at June 7. That’s the least number of rigs since February 2018. Speculative accounts trimmed net long positions for a sixth week to June 4, and they are now at the least since the week of March 12.
WTI Daily Chart
Source: OANDA fxTrade
Natural gas looks poised to extend the current rally to a third straight day today. That would be the longest rising streak in a month as investors balance weather forecasts which show some above- and some below-normal temperatures across the US for the period June 15 to 19. Weekly natural gas inventories data from the EIA showed another weekly add to stockpiles last week. That makes it the 10th week in a row that inventories have increased.
China’s Liquefied Natural Gas (LNG) imports in May rose 2.3% from a year earlier to 10.43 billion cubic meters, which brought the January to May total to 54.37 billion cubic meters, a 13.4% jump from the same period the previous year.
Agriculturals
Wheat prices continue to consolidate a four-week meteoric rise which saw the commodity reach levels not seen since Feb. 6. The commodity jumped 27% from May 13 to June 4, to hit 5.222. It’s now at 4.981.
The supply side is looking a bit mixed, with rain showers in China’s north possibly affecting harvests, while the latest report from the U.S. Department of Agriculture, Foreign Agricultural Service (FAS), sees Russian output increasing in the current season.
Speculative investors scaled back their bearish bets to the lowest since the week of Feb. 12, according to data as at June 4 from CFTC.
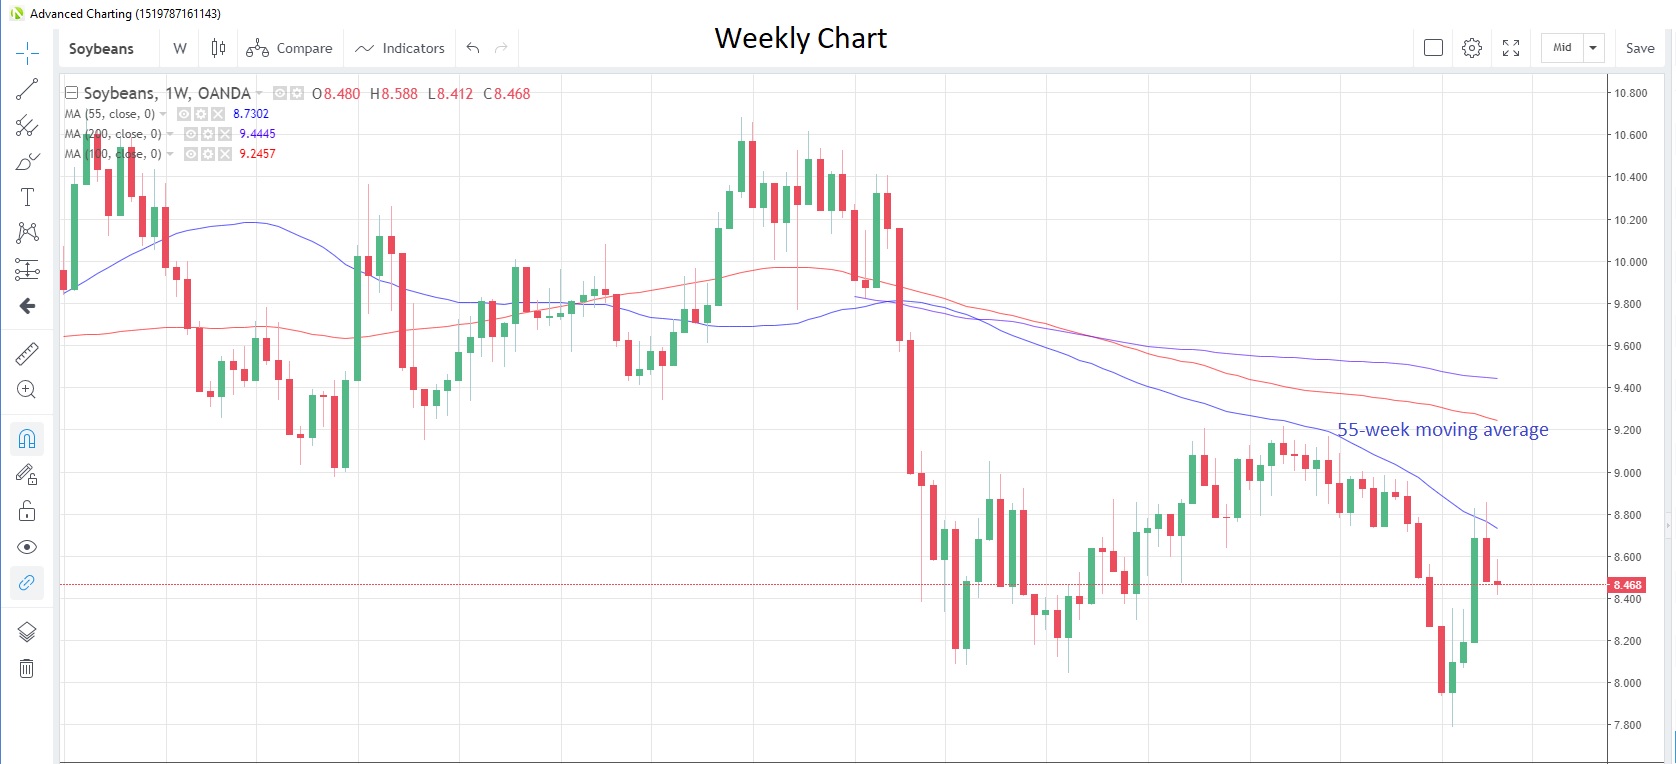
Soybeans have failed to extend the positive momentum that pulled prices from more than decade lows. Upward momentum was lost last week for the first time in four weeks, and the commodity again failed to close above the 55-week moving average, which is at 8.73 now, as it has done since May last year.
May customs data from China show that soybean imports were down 24% year-on-year at 7.36 million tons, the lowest total in four years for the month of May, as the swine fever that has gripped the nation for the past few months has cut the demand for soy in animal feed.
Soybeans Weekly Chart
Source: OANDA fxTrade
Corn ’s three-week rally came to an end last week and the commodity is now consolidating the advance to a near three-year high. The U-turn could have been instigated by a USDA report from the FAS, which suggested Brazil was close to realizing record production in the 2019/20 season. The same report estimated that Thai production would be lower during this season due to a pest infestation in some of the crops.
Speculative investors have been well-positioned for the recent rally, adding to net long positions for a fifth straight week. Net longs are now at the highest since the week of June 19 last year.
SUGAR has been grappling with technical resistance at the 100-day moving average at 0.1240 since the latter part of last week. Prices have failed to trade above the average since April 25. Speculative investors were net buyers of the commodity for the first time in six weeks, according to the latest data from CFTC as at June 4.


