Expectations for a continued dovish statement from the Fed after the FOMC meeting later this week is pressurizing the U.S. dollar and giving a lift to most commodities.
Energy
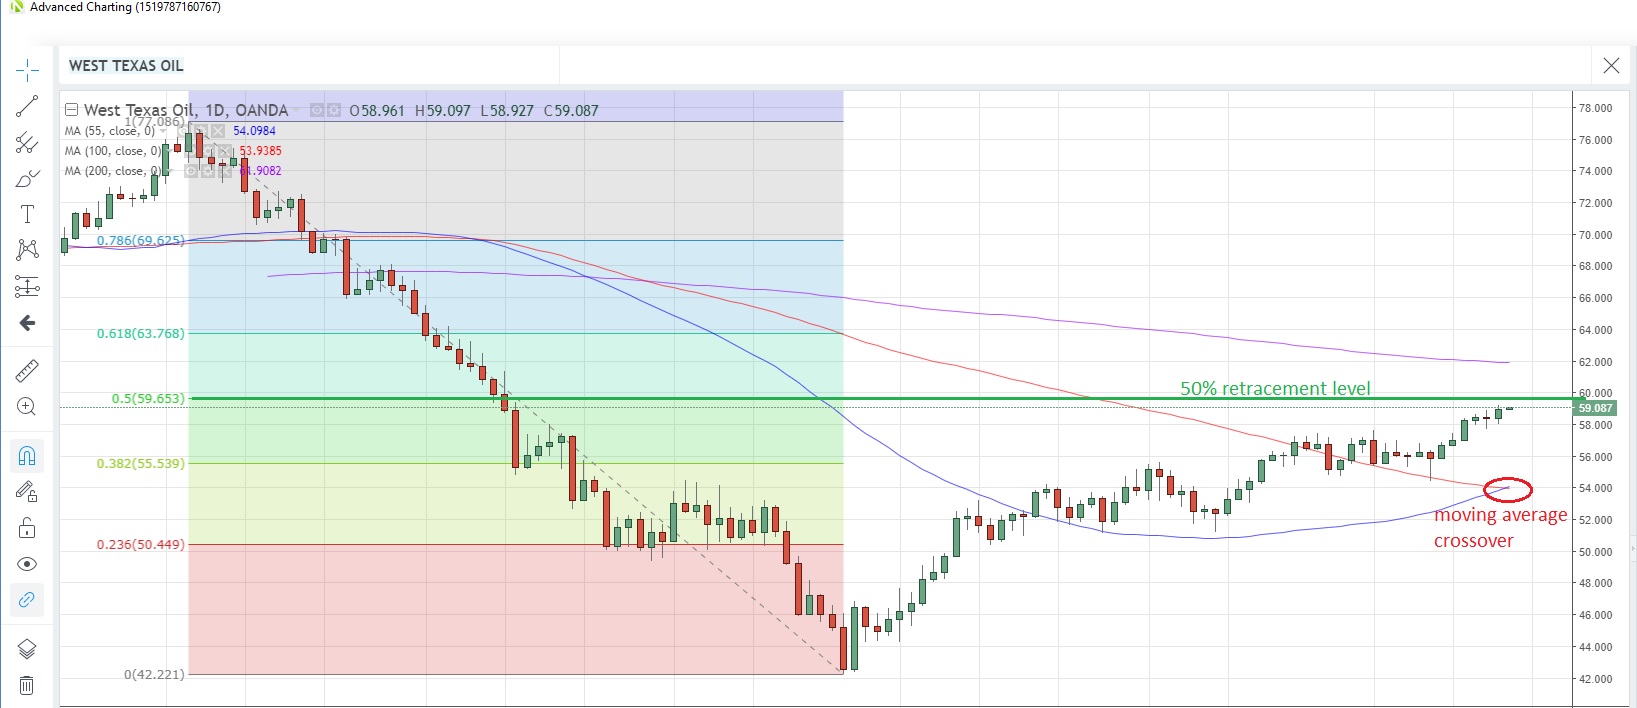
Crude Oil is on track to advance for a sixth day out of the last seven, touching the highest since November 13 yesterday, after OPEC and its allies announced at the weekend its determination to follow through with production cuts until at least June, and possibly to the end of the year.
Saudi Arabia has reportedly pledged bigger-than-needed cuts in shipments next month, while Russia said it also intends to speed up its progressive reductions. While rising U.S. production is mitigating the loss of production from Venezuela and Iran sanctions to some extent, OPEC cutbacks appear to be winning the fight at the moment, as West Texas Intermediate is now up 40% from the December low of $42.20.
The 55-day moving average crossed above the 100-day moving average earlier today for the first time since November 7, and this is often interpreted as a longer-term bullish signal. Speculative non-commercial traders are most bullish on oil prices since the week of November 20, after increasing net long positions for a fourth straight week in the week to March 12, CFTC data shows.
Source: OANDA fxTrade
Speculative investors reduced their net short positions in Natural Gas for the first time in five weeks in the week to March 12, according to the latest data snapshot from CFTC. Some profit-taking probably took place as gas prices fell for the first time in five weeks last week. Prices rebounded yesterday and are currently at 2.839, edging toward the 55-day moving average at 2.9056.
Reflecting the lower prices seen since December, the cost of Japan’s LNG imports fell 0.5% from a month earlier in February, the first monthly decline since October 2017, according to preliminary data from the Ministry of Finance. The planned start of gas shipments from Israel to Egypt have been delayed until at least mid-year due to pipeline issues.
Precious metals
Gold looks set to post its third weekly gain in a row as the U.S. dollar retreats ahead of the FOMC meeting. The metal has once again recouped the $1,300 handle, and is currently at $1,306.07 with the 50% retracement of the February 20 to March 5 drop sitting at $1,313.99.
Speculative accounts reduced their net long positions for a third straight week to March 12, CFTC data shows, as investors lost patience with the lack of upward progress for the precious metal. Net longs are now at the lowest since the week of January 22.
Silver is consolidating the push above the 200-day moving average earlier this month, and is poised for its third consecutive daily gain. The 100-day moving average has moved above the 200-day moving average for the first time since February last year.
Speculative investors scaled back their net long positions to the lowest this year, but exchange-traded funds added 3.6 million troy ounces to their holdings last Friday, the biggest one-day increase since November 13, according to Bloomberg reports.
The gold/silver (Mint) ratio is marginally lower on the week, but has held above the 100-day moving average on a closing basis so far this month.
Platinum is in the process of recouping lost ground from the fall two weeks ago which stalled at the 55-day moving average support at 818.63. Despite the rebound, speculative investors were net sellers for the first time in four weeks amid some profit-taking.
There was some good news on the supply front as a South African court said Friday that a plan by the Association of Mineworkers and Construction Union (AMCU) to widen a strike at one mine over a wage dispute to other mines would be illegal.
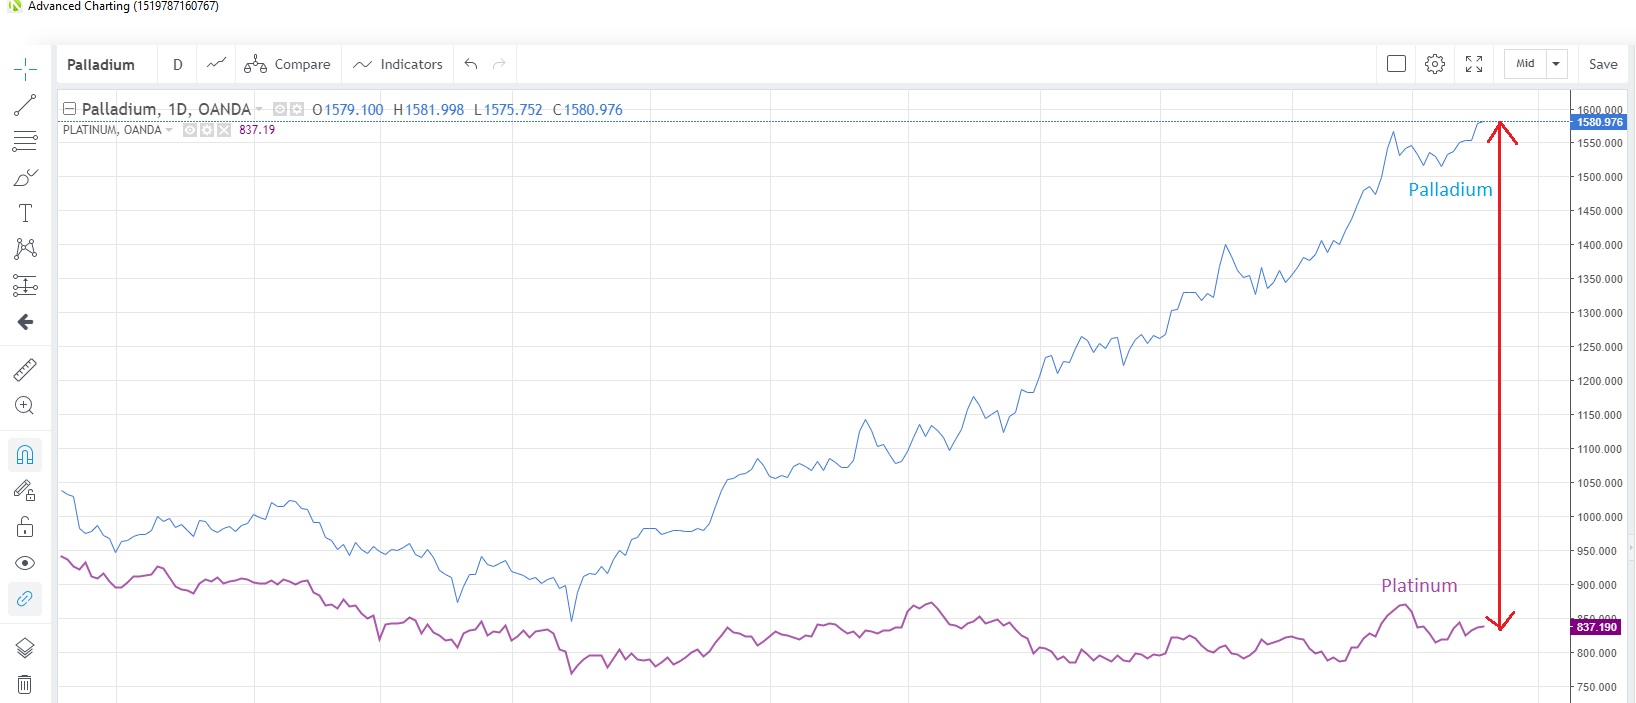
Palladium has continued its push to record highs again this week, though speculative investors have been booking some profits on the way up, reducing positions for a second straight week, according to the latest data from CFTC. Net long positions have now fallen to the lowest since the week of October 30.
The palladium/platinum spread has widened to a record level as platinum fails to match palladium’s advance. Palladium is now at 1,580.98 and platinum at 837.19.
Base metals
Copper is trading in the middle of a two-week range with investors mostly sidelined, for now. In a Bloomberg survey conducted last week, the majority of copper traders were neutral on the metal, highlighting that it was capped by a weakening macro outlook yet supported by tight fundamentals. The industrial metal shrugged off China’s decision to cut VAT rates from April 1, though prices were marked lower in a knee-jerk reaction to the news at the time.
China’s copper production rose 6.3% from a year earlier in the January-February period to 1.34 million tons, despite the Lunar New Year holidays, according to data published by the National Bureau of Statistics yesterday. LME copper inventories jumped to a five-month high on Friday, posting the biggest one-day increase since November amid inflows from Asia.
Agriculturals
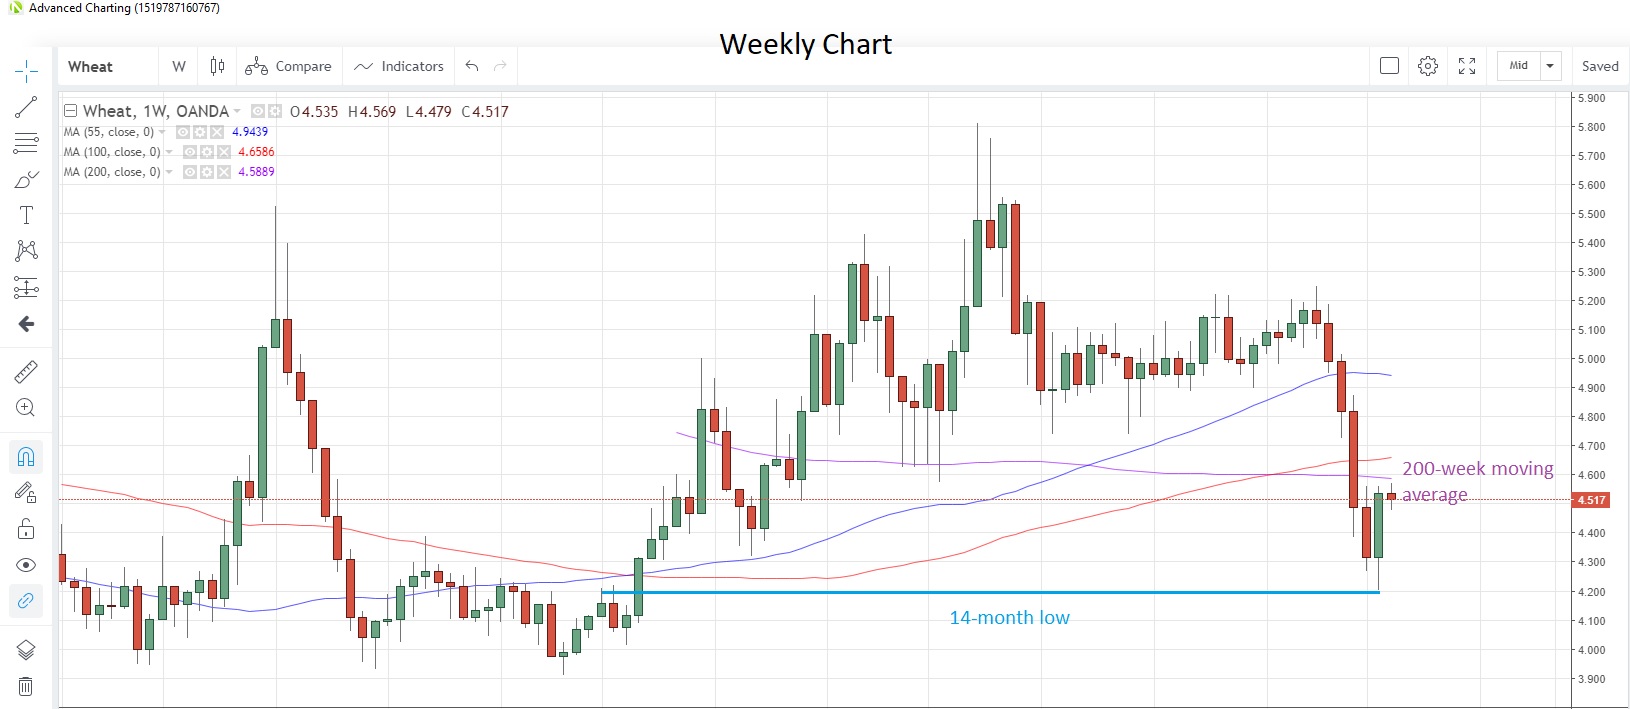
Wheat recorded its biggest weekly gain since July last week as uncertainty about future U.S. harvests surfaced after the Great Plains growing area in the U.S. was blanketed by snow and subjected to high winds. Russia’s wheat exports in the current season since July 1 are up 3% y/y so far, according to tentative data reported by Russia’s grain agency.
Speculative investors reduced net long positions for the first time in four weeks to March 12, after reaching the most extreme levels since January 2018, according to the latest data released by CFTC. Wheat is now at 4.526 after rebounding from 14-month lows last week.
Soybeans survived a test of the 200-day moving average support at 8.787 early last week to post a higher weekly close for the first time in three weeks. Fears of supply constraints helped the rebound as rains in Brazil restricted consignments to ports, while a strong domestic currency persuaded Argentinian farmers not to send their crops to the international market. Separately, Brazil reported that its soy harvest was 61.8% complete as of last Friday.
Speculative investors remain skeptical about the rally however, as they increased their net short bets to the most since the week of September 18, the latest data shows. Soybean prices are now at 8.939 and seem to be struggling to overcome the 55-week moving average, which is at 9.1123 today. That moving average has capped prices since the week of June 4 last year.
The prospect of reduced supply going forward has prompted a rebound in Sugar prices over the past 10 days. Beet planting in Europe is seen falling 5% to 1.55 million hectares, the most in four years, amid a supply glut that has worsened over the past two years, according to a French growers association. In addition, reports of adverse weather conditions in Brazil has heightened concerns about the next harvest.
Before the sharp rebound, speculative accounts were the most bearish on sugar in five months, according to the latest data snapshot from CFTC. Sugar closed at 0.12898, the highest since February 27, and is testing resistance at the 100-week moving average of 0.1288.
Corn had its biggest weekly jump since October last week as it snapped a two-week losing streak. Speculative investors are still bearish on the commodity, being net sellers for a fifth straight week to January 12 and boosting net short positions to the most since November 2017. Corn is now at 3.633 with the 100-day moving average at 3.6585.


