So, did U.S. drivers do the deed?
Despite rising U.S. coronavirus cases and pleas for socializing in small numbers, crowds still flocked to America’s favorite hot spots for Memorial Day in an encouraging sign of travel that should have translated to some gasoline demand during the three-day long weekend.
Yet, there was no telling how many road trips—another Memorial Day staple along with beach-flocking and barbecuing, of course—were part of the deal. Without the annual forecast from the American Automobile Association due to the pandemic, there was no marker to begin with. What we can predict with some accuracy though is that this year’s figures will be nowhere near to the 43 million Americans who took to the road last year for Memorial Day.
How Much Gas Did Americans Burn On Memorial Day?
Bloomberg’s Chief Energy Correspondent Javier Blas wrote on Twitter, where he has more than 90,000 followers, that Apple’s mobility trends for U.S. driving pointed to “a massive increase in mobility in the U.S. (driving).”
“Interesting to see whether this translates (to) more gasoline demand,” Blas said, noting that implied demand didn’t pan out in the EIA’s last dataset for the week to May 15. The Apple mobility chart Blas tweeted suggested that driving had risen to the 25% mark for the week to May 22, from a previous 10%. But it was hard to say whether it was a week-on-week gain due to the absence of granular timeline markers.
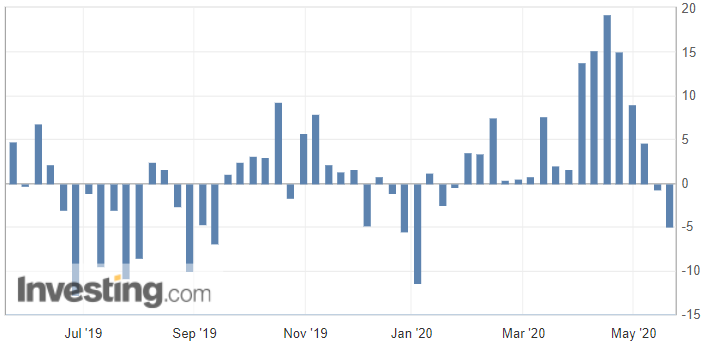
U.S. gasoline inventories gained unexpectedly by 2.8 million barrels for the week to May 15, versus forecasts for a drop of 2.1 million barrels. To offset any bearish sentiment from the gasoline build, crude stockpiles fell 5 million barrels against a forecast build of 1.2 million.

Anecdotally, the overall degree of mobility in the U.S. seemed to depend on which side of the coast one lived on, and whether the individual’s penchant for adventure and wanderlust was on the wrong side of the law.
In California, the popular Eaton Canyon Natural Area Park and Trails opened up before the Memorial Day weekend with several safety precautions but was quickly shut down because of surging crowds.
In Chicago, throughout the city and suburbs, parades and solemn ceremonies with large crowds were replaced by smaller events streamed online as local leaders tried to balance paying respect to those who died serving their country while respecting social-distancing rules.
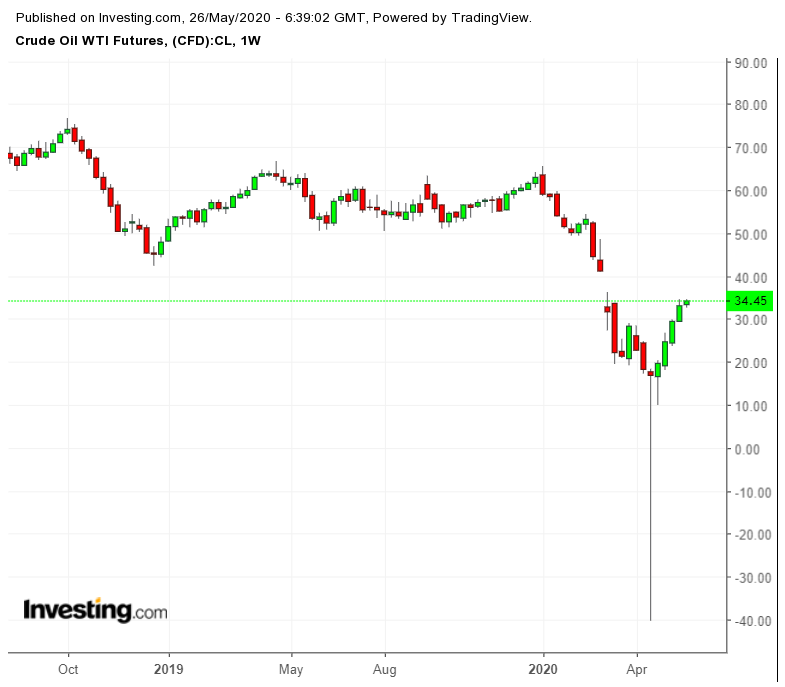
Bets on higher gasoline demand through Memorial Day helped U.S. crude’s U.S. West Texas Intermediate benchmark gain 13% last week, and 230% in all from an April 28 bottom of $10.07 per barrel.

Is WTI Pursuing A "Self-Defeating" Rally?
WTI is still down 45% on the year. But the front-end of the market seems to have developed the velocity of a bullet train and few bears appear willing to stand in its path. To illustrate, by Tuesday afternoon in Asia, the U.S. crude benchmark had recouped its cumulative 3% decline from Friday’s regular session and Monday’s trading conducted electronically during the Memorial Day holiday.
“Only a fall through $30 a barrel would negate the bullish technical picture for WTI for now,” said Jeffrey Halley, an analyst at New York’s OANDA.
Even so, some are questioning if the rebound in U.S. crude has been overdone. Analysts at Goldman Sachs, in a note on energy equities, issued to the firm's clients on Monday, asked whether WTI was on the path of a "self-defeating oil rally."
"With WTI in the low $30s/bbl, there is concern that a reversal of shut-in production could come too soon and ultimately warrant a longer period of limited shale drilling activity," said Goldman, Wall Street’s most influential voice in oil trading.
Brent Has More Oil Floating Now
New York-based Energy Intelligence, meanwhile, reported that global oil stocks for crude and products jumped by a record 1 billion barrels this year from January-April and will likely accrue another 400 million bbl before production cuts and demand recovery can start rebalancing the market this summer.
These stocks of oil have shown up everywhere—first in popular trading hubs, then in more secondary locations and then at sea, where the month of April saw another record for the incremental jump in oil stashed aboard Very Large Crude Carriers to sell at a later date.
While stock accumulations are ongoing globally, the flow to U.S. tanks is slowing, and primary hubs in America are starting to move oil through the system again.
Energy Intelligence added:
“Terminal managers have been offering storage in coveted trading hubs like the Nymex products terminal in New York City harbor and crude oil space at the Louisiana Offshore Oil Port in St. James, Louisiana."
That aside, Seevol.com reported a 4.26-million barrel decline for the week to May 22 at the Cushing, Oklahoma hub that stores crude delivered against expiring spot contracts of WTI.
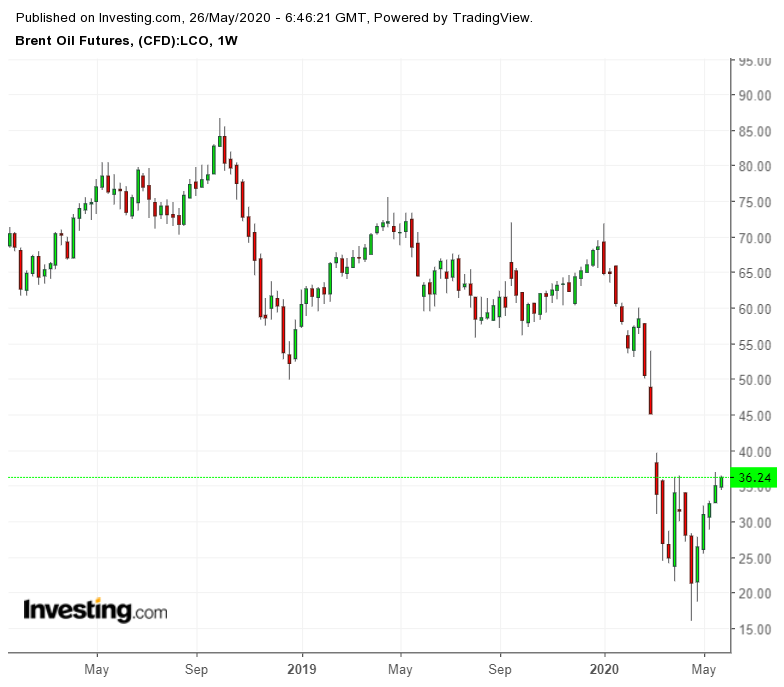
Seevol’s estimate signals the steady decline in Cushing stocks. In the previous week to May 15, the Energy Information Administration reported a drop of 5.8 million barrels at Cushing. The drain in Cushing inventories has been one of the drivers for WTI’s relative outperformance against its London-traded rival, Brent, over the past month. While both benchmarks are down by about the same quantum for the year, Brent only gained 8% last year versus WTI’s 13%.

U.S.-Sino Tensions Top Of Market Concerns Too
EIA data aside, this week’s action in oil will also depend on how the U.S.-Sino tensions evolve.
The prospects of a trade war between China and the western economies ratcheted up on Sunday as Beijing accused Washington of pushing relations towards a “new cold war,” amid President Donald Trump’s desire to take Hong Kong’s side in the island territory’s democratic showdown with its Chinese mainland. Trump has also hinted that China spread the coronavirus in a bid to weaken his administration.
“China has no intention to change, still less [to] replace the United States” administration, China’s foreign minister, Wang Yi, said on Sunday in the latest escalation in tensions between the world’s two largest economies. “It’s time for the United States to give up its wishful thinking of changing China and stopping 1.4 billion people in their historic march toward modernization.”
Gold Steady at $1,730 Amid Stocks, Dollar “Noise”
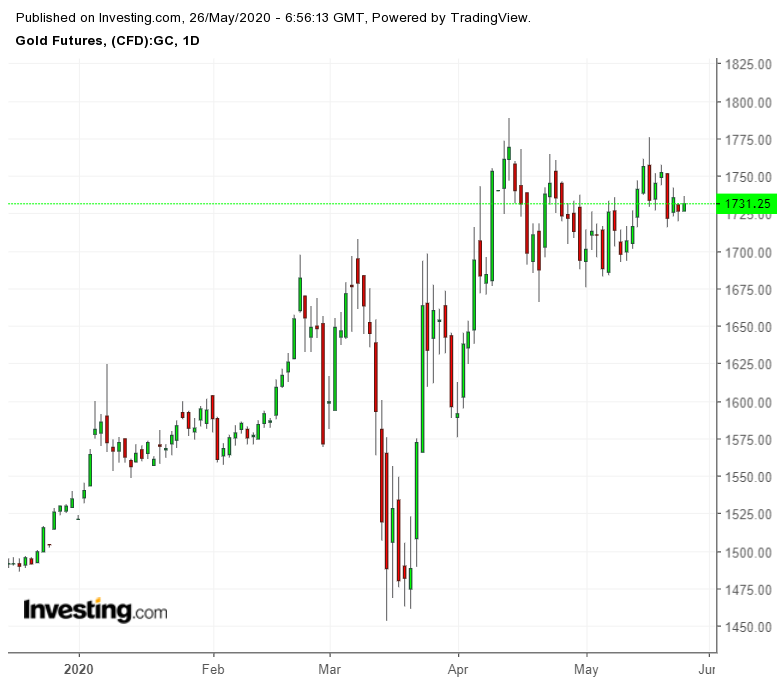
In the case of gold, futures of the yellow metal started the week on a slightly soft note while holding steadily above the $1,730 level.

While gold’s long-term bull case seemed intact, daily ‘noise” from stocks and the dollar was weighing on the safe-haven, said analysts.
“I think the play into stocks and other risk assets has probably supported the risk appetite, and diminished the appeal for gold in the short term,” IG Markets analyst Kyle Rodda told Reuters.
“There still seems to be the broad issue of gold prices trying to break too far above the $1,740, $1,750 mark.”
Disclaimer: Barani Krishnan does not own or hold a position in the commodities or securities he writes about.
