Gold has finally gotten past the $1,850 barrier, nearly two weeks after its return to $1,800 pricing. While $1,900 is the next target, of course, gold's recent struggle to clear a mere $50 passage required some asking. So how long will it take this time and will it fail this test?
As Canadian life/business coach Rick Scott emphatically said: “Anything is possible, everything is not”.
In gold’s case, this could be interpreted to mean some more tough trials lie ahead. But the present set up and momentum it is riding will also likely prevent it from being stuck at the $1,850 level too long, without a serious attempt fairly quickly for $1,900 and above.
Most importantly though, is whether it will leverage all the expectations of inflation that have been building across the US economy and financial markets for weeks now, to make a renewed push toward the highs above $1,960 it left off in January, or possibly even the peaks above from August.
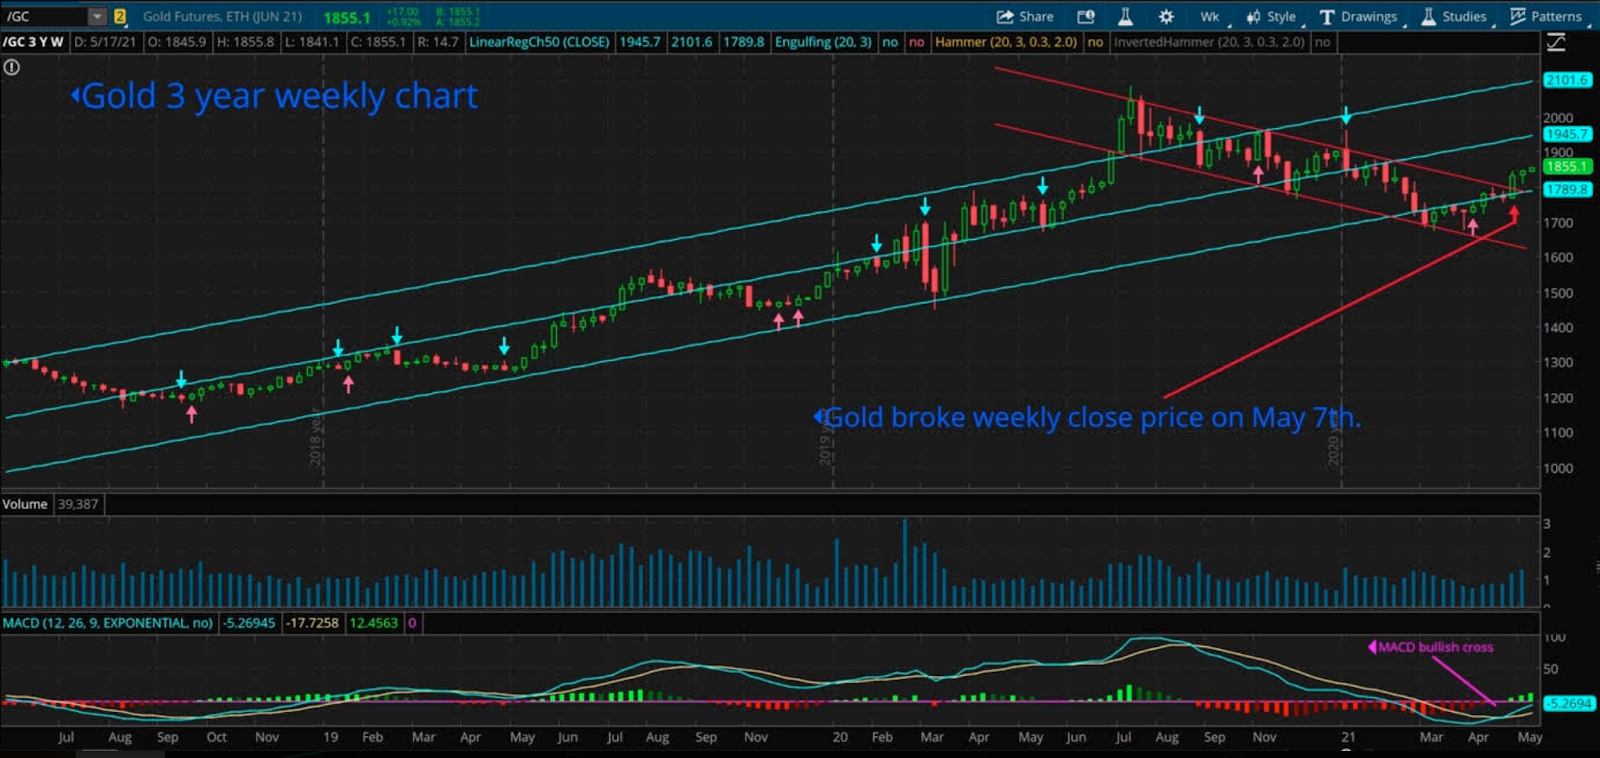
And the answer in the 3-year weekly chart for COMEX gold futures that I’ve drawn up for Investing.com below clearly indicates that both are possible.

Source: Investing.com
Since its return to the $1,800 berth on May 6, gold futures on New York’s COMEX have been on an upward—though admittedly muddled—path that finally led to the breakthrough peak of $1,855.85 at the time of writing, in Monday’s Asian trading.
Next $50 Climb Extremely Crucial
Given its trajectory, the next plausible target should be $1,945.70, which will be a peak not seen since the Jan. 6 intraday of $1,966.80.
Still, anyone who has traded or followed gold over the past six months will know that a $90 upside could be a bridge too far for the yellow metal in short order. Therefore, setting the bar at $1,900 (which comes on the chart at just under $1,945.70) might be wise.
All will depend on whether the next $50 climb is attainable for gold. Otherwise, Investing.com’s signals on the 3-year weekly chart show a very likely return to below $1,800 levels—precisely $1,789.80, erasing all gains since May 6.
But if gold indeed crosses $1,900 and $1,950 next, it means sentiment in gold isn’t about to recede meaningfully. That means that $2,000 could be on cue, precisely $2,101.60—which comes just slightly beneath the all-time COMEX futures peak of 2,107.60 set on Aug 7.
Will There Be Measured Moves Instead?
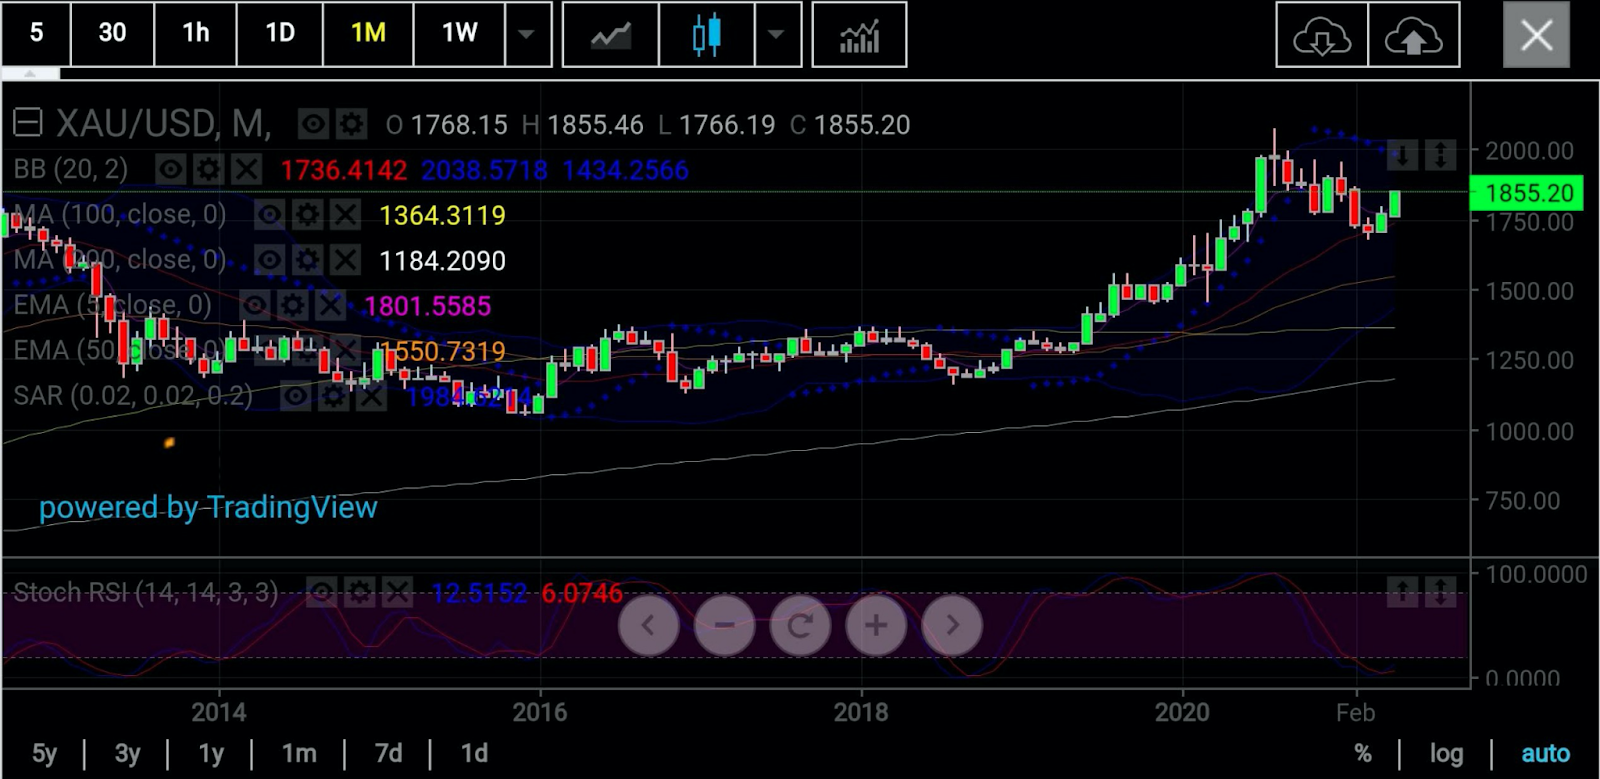
Sunil Kumar Dixit of S.K. Dixit Charting concurs with Investing.com’s 3-year weekly readings for gold, though his immediate projections call for more measured moves within the $1,860 to $1,880 channel.

Source: S.K. Dixit Charting
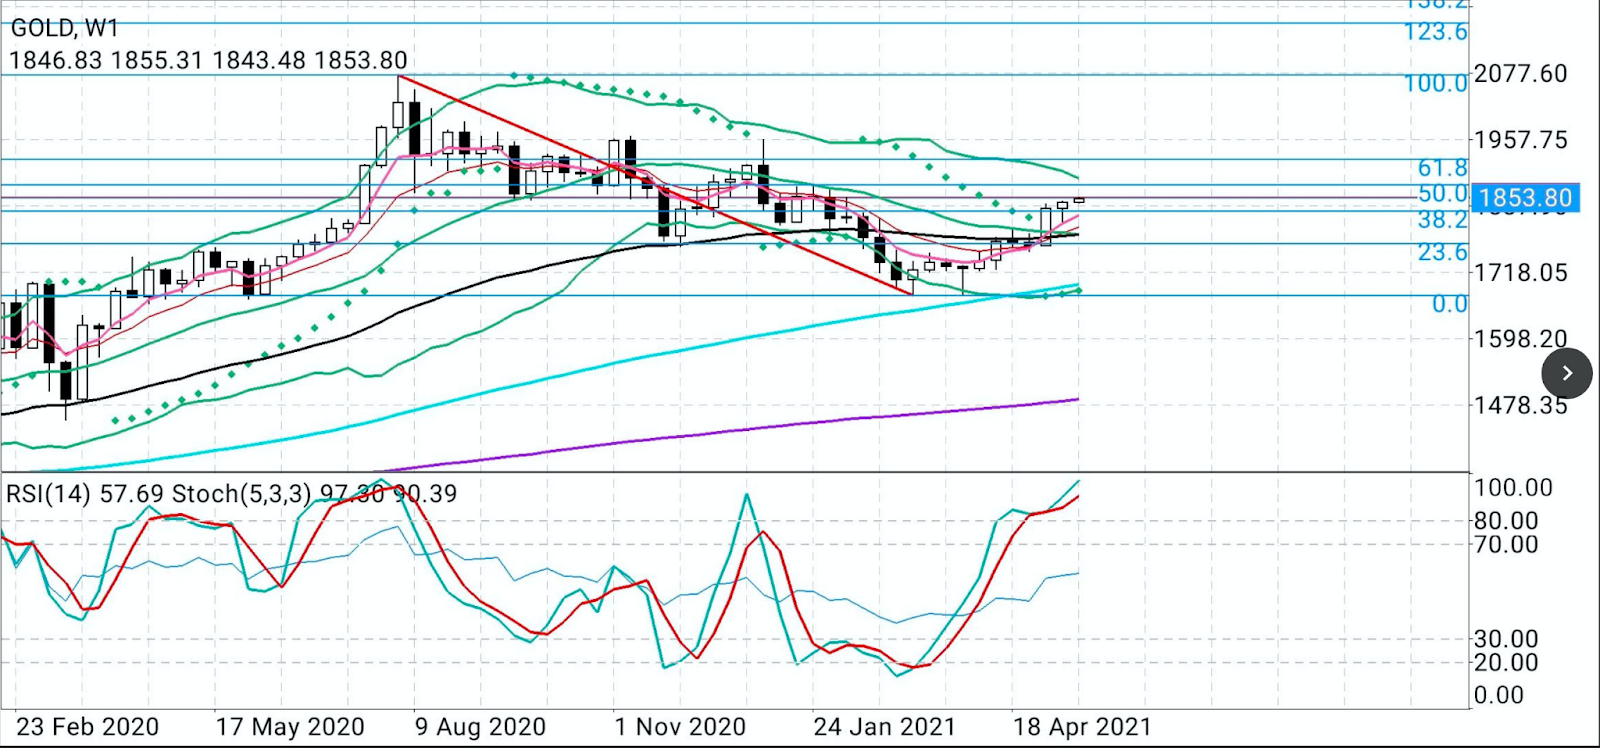
Plotting the likely path for spot gold or bullion, Dixit said descending 200-Day Simple Moving Average of $1,844 has provided strong support to clear $1,850 and possibly $1,855.
Traders and fund managers sometimes decide on the direction for gold by looking at the spot price—which reflects bullion for prompt delivery—instead of futures.

Source: S.K. Dixit Charting
Adds Dixit:
“As long as spot gold holds on the right side of 200-Day SMA of $1844, traders can try to aim for $1,865 and $1,876, which marks a 50% Fibonacci retracement from the August record high of $2,075 to this year’s low of $1,676.”
He says stochastic RSI, or Relative Strength Index, positivity also supports spot gold’s “ongoing upside momentum with the potential to achieve more gains.”
Runaway Inflation Signals
Gold longs have had an eventful couple of weeks after arguments about runaway inflation in the United States were reignited by a raft of data on consumer and producer prices, industrial production and consumer sentiment.
The US Consumer Price Index grew by 4.2 percent in the 12 months to April for its largest increase in almost 13 years, while the Producer Price Index expanded by 6.2 percent last month over a one-year period, for its biggest expansion in a decade.
US industrial production rose 0.7 percent in April, slowing by a third from March as carmakers idled some plants after a shortage in auto circuitry microchips although a spike in mining still boosted activity, the Federal Reserve reported.
An early reading of US consumer confidence in May showed a drop as Americans worried about inflation and its impact on their income, the University of Michigan said in a survey closely followed by the country’s economists.
US retail sales, meanwhile, turned flat in April after a jump of nearly 11 percent in March, according to data from the Commerce Department that took some heat off inflationary expectations in an economy rapidly recovering from the coronavirus pandemic.
The Federal Reserve acknowledges price pressures arising from bottlenecks in supply chains struggling to cope with demand in an economy reopening after months of pandemic-suppression.
But the central bank insists that these inflationary pressures are “transitory” and will fade as the economy makes a full recovery from the pandemic. It also says it does not see the need for now to raise interest rates.
Logically, gold should have rallied on the ramping inflation signal given its long-standing role as a store of value and hedge against rising costs.
But in markets ruled by distorted expectations and hype, there is little room for logic.
So, the Dollar Index and 10-year Treasury note have rallied intermittently with gold, hampering the yellow metal’s chance of a breakout on its own.
Disclaimer: Barani Krishnan uses a range of views outside his own to bring diversity to his analysis of any market. For neutrality, he sometimes presents contrarian views and market variables. He does not hold a position in the commodities and securities he writes about.
