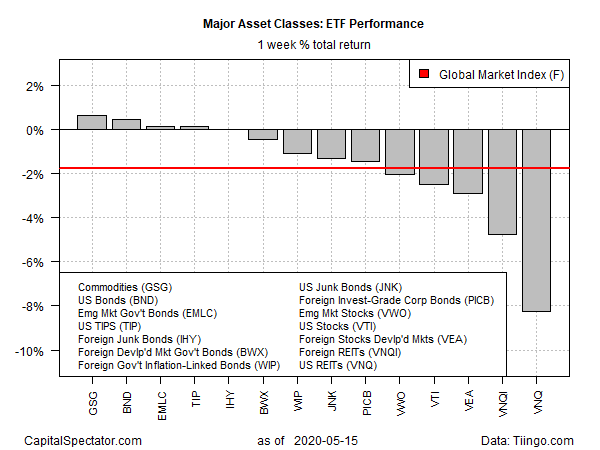
Broadly defined commodities recovered lost ground last week, marking the third straight weekly gain. Once again, the rise delivered the strongest weekly advance for the major asset classes, based on a set of exchange-traded funds through Friday, May 15.
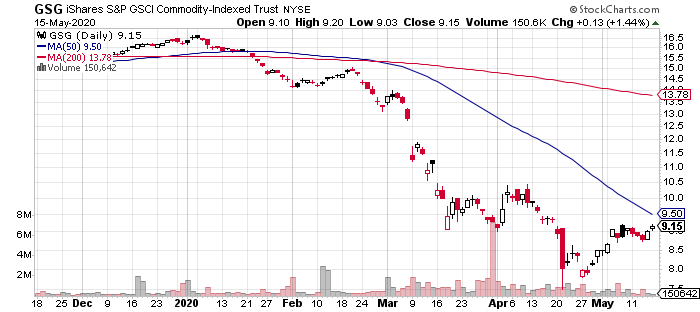
The iShares S&P GSCI Commodity-Indexed Trust (GSG) edged up 0.7%. The fund ended last week at its highest close since Apr. 17.
Despite the recent rally, the longer-run trend for GSG remains deeply negative. Thanks to a dark aura hanging over the global economy’s near-term outlook due to coronavirus blowback, the odds appear low for a sustained rally in commodities for the immediate future.
A related risk factor for the global outlook: rising trade tensions between the US and China, the world’s biggest economies. “We are increasingly concerned about US-China trade risks, as China will be unable to meet ‘Phase 1’ trade commitments and is facing criticism about the way it has handled COVID-19,” Bank of America’s foreign exchange analysts wrote in a research note today.

Overall, most of the major asset classes posted losses last week. The biggest setback: US real estate investment trusts (REITs). Vanguard Real Estate (VNQ)) shed 8.3%, leaving the fund close to its lowest close in over a month. Commercial property is being repriced for a new world order of softer demand for office space as a greater share of the workforce works from home.
The downside bias in asset prices overall took a bite out of an ETF-based version of the Global Markets Index (GMI.F) last week. This unmanaged benchmark that holds all the major asset classes (except cash) in market-value weights via ETFs slumped 1.8%–the index’s first weekly loss in three weeks.

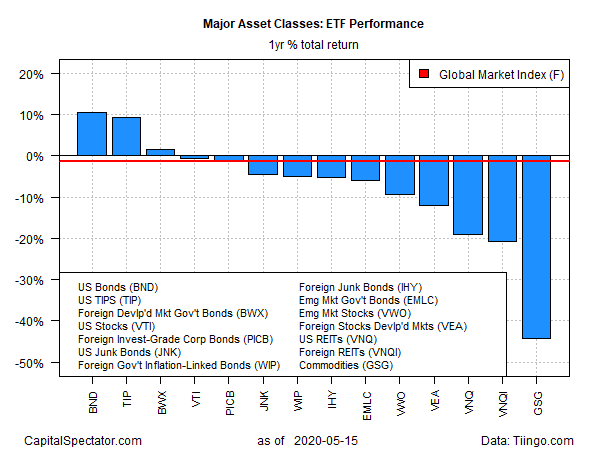
Ranking returns for the one-year window continues to show a broad measure of US investment-grade bonds in the lead for the major asset classes. Vanguard Total US Bond Market (NASDAQ:BND) is up 10.3% on a total-return basis for the trailing one-year period after factoring in distributions.
At the far end of the spectrum for loss: commodities remain the worst one-year performer by far. Despite the recent rally, GSG has tumbled a hefty 43.6% at Friday’s close vs. the year-earlier price.
GMI.F slipped back into negative terrain for the one-year trend after last week’s loss. This multi-asset-class benchmark is off 1.3% for the past year.

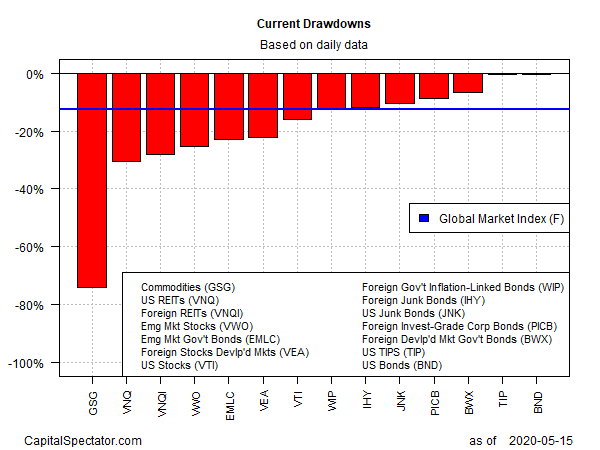
Ranking asset classes via current drawdown still reveals a wide range of results, ranging from the deep 74% peak-to-trough decline for commodities (GSG) to the fractional drawdown for US investment-grade bonds (BND).
For comparison, GMI.F’s current drawdown is -12.5%.

