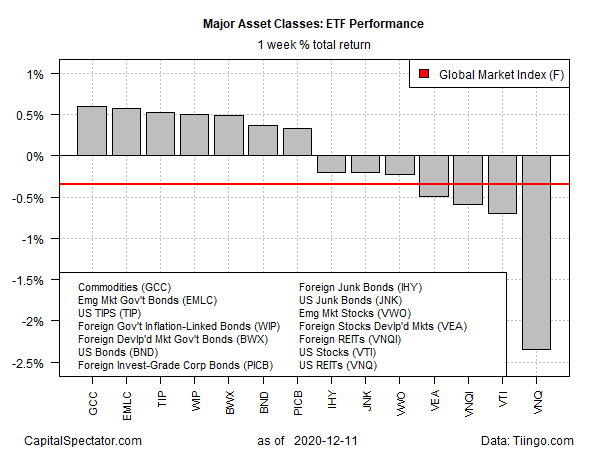
Broadly defined commodities posted the strongest gain for the major asset classes in last week’s trading, followed closely by wide-ranging rallies in fixed-income markets around the world, based on set of ETFs. US real estate investment trusts (REITs), by contrast, posted the deepest loss by the end of the trading week (Friday, Dec. 11).
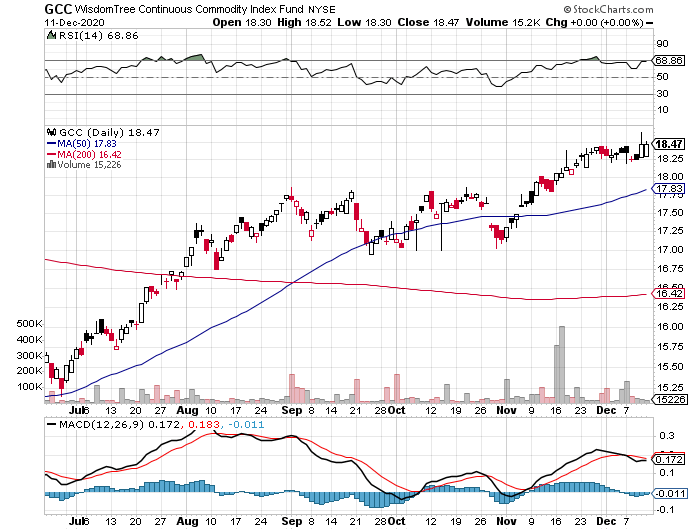
WisdomTree Continuous Commodity Index Fund (NYSE:GCC), which tracks an equal-weighted index holding more than a dozen commodities, rose 0.6% for the week, lifting the fund to its highest close since January.

Optimism related to vaccine development and a rollout in the US is said to be a key driver of higher commodity prices. “Speculative flows are in the driving seat amid easy financial conditions,” advise Morgan Stanley analysts, who note that a projected economic recovery for 2021 suggests that “the peak for commodity prices is yet to come.”
US REITs suffered the deepest loss last week for major asset classes. Vanguard Real Estate Index Fund ETF Shares (NYSE:VNQ) fell 2.4%, the biggest decline by far.
The Global Markets Index (GMI.F) fell last week for the first time in six weeks. This unmanaged benchmark, which holds all the major asset classes (except cash) in market-value weights via ETFs, slipped 0.3%.

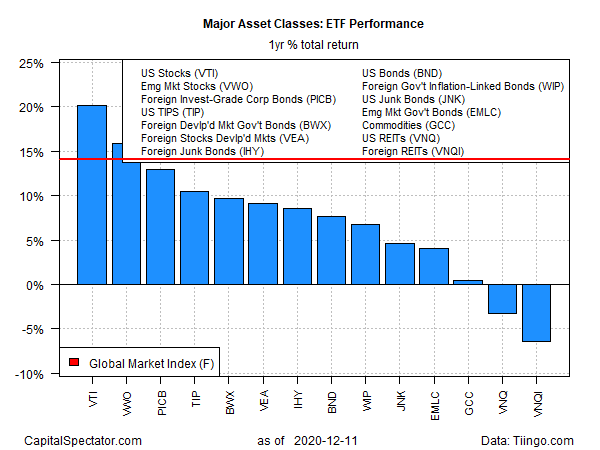
For the one-year trend, US equities continue to lead the major asset classes by a wide margin. Vanguard Total Stock Market Index Fund ETF (NYSE:VTI) closed on Friday with a 21.1% total return for the trailing 12-month window.
The weakest one-year performer: foreign property shares. Vanguard Global ex-US Real Estate Index Fund ETF (NASDAQ:VNQI) is down 6.4% over the past year (252 trading days).
GMI.F is up 14.1% over the past year.

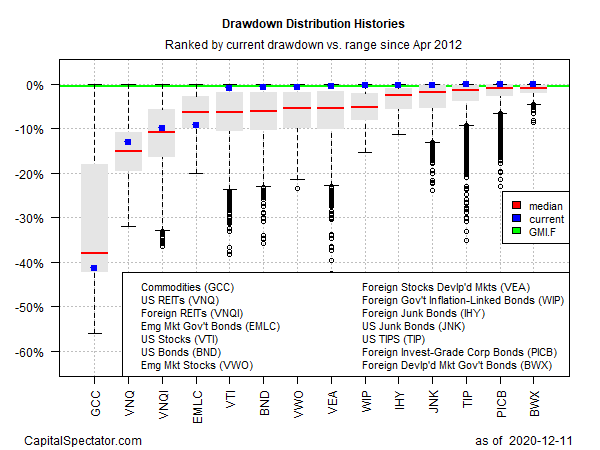
Ranking global markets by current drawdown continues to show that most of the major asset classes are at or near price peaks. Leading the list is SPDR Bloomberg Barclays International Treasury Bond (NYSE:BWX), which has a zero peak-to-trough decline after closing at a record high on Friday.
Meantime, broadly defined commodities (GCC) continue to suffer the deepest drawdown—the fund is currently posting a peak-to-trough slide in excess of negative 40%.
GMI.F’s current drawdown is a slight -0.4%.

