A bullish trend structure has been developing nicely on EUR/AUD, which could extend gains following an anticipated correction.
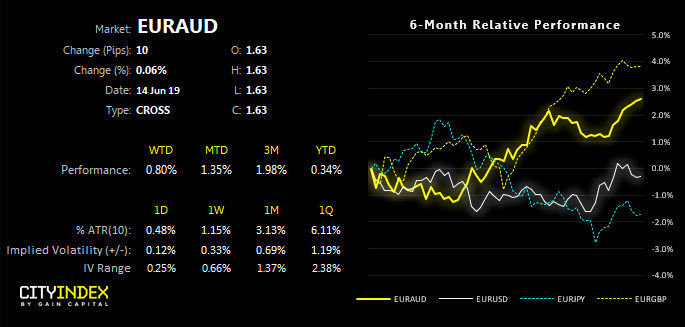
Its trend has been supported by a diverging theme between AUD and EUR, which involves a dovish RBA, expectations for a Fed easing cycle (weaker USD/stronger EUR) whilst traders have been extensively net-short Euro and beckoned a sentiment extreme.
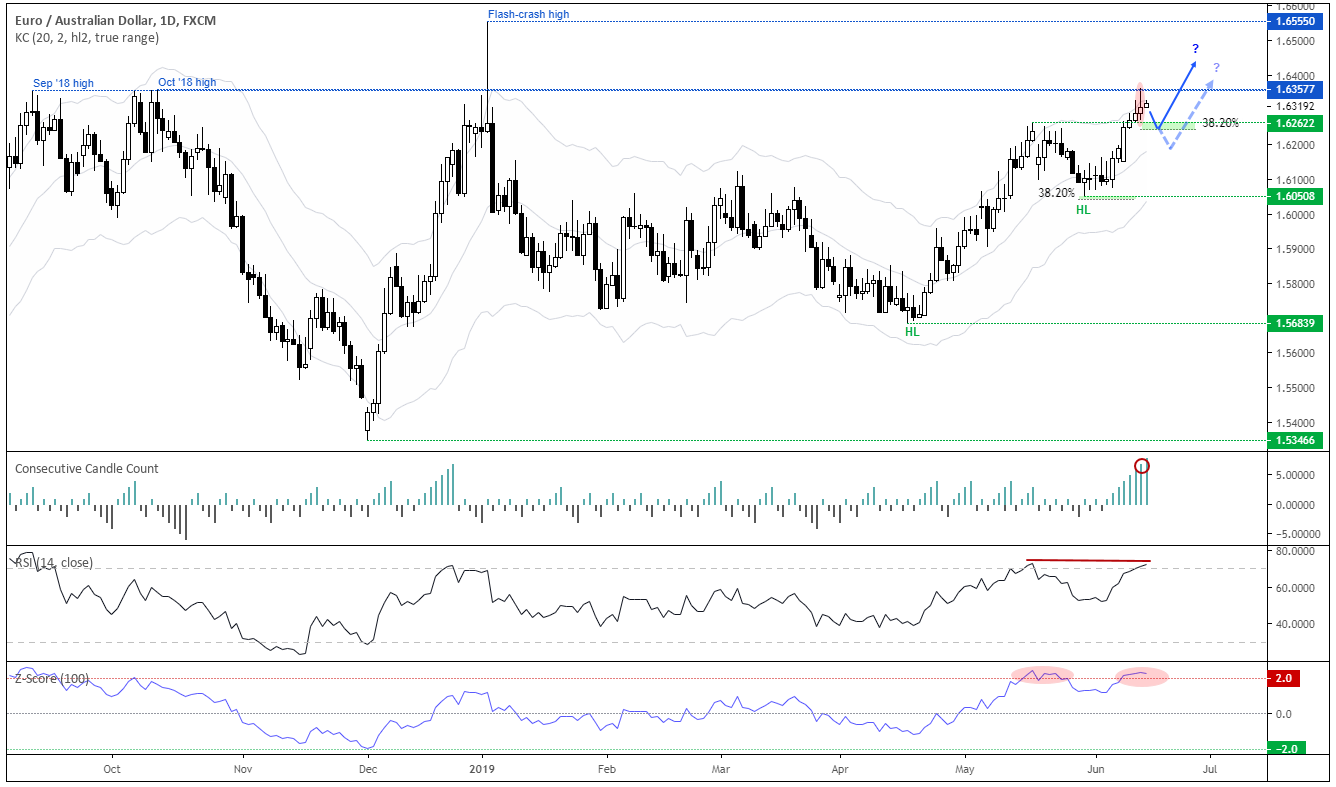
On a closing basis, the daily chart is trading at its highest level since October 2018 and yesterday’s high reached its most bullish level since January’s infamous flash crash. And, as we’ve seen two higher lows leading into resistance, and the leg higher from 1.5684 appears impulsive, we’re looking for an eventual upside break.
However, prices have found resistance near the September and October highs, making it an area rip for profit taking. And as several technical indications point towards over-extension for the near-term, we suspect EUR/CAD could be due a correction before its next leg higher.

- Z-score 100 (standard deviations away from its 100-day average) is been over two standard deviations for 4 sessions.
- As of yesterdays close, it’ produced 7 consecutive bullish candles and up days.
- A bearish divergence with RSI is forming
- A bearish hammer respected the Sep/Oct highs
Taking the above into account, we’d prefer to see some mean reversion before seeking a long entry on this timeframe. Whilst it is not guaranteed prices will retrace immediately, there appears to be enough warning signs which warrants caution at these levels for a long position. If prices consolidate at the highs build a base after a correction, we’d feel more comfortable with bullish setups on the daily chart.
