The recent commodities sell-off has been breathtaking. This is especially true since the most-recent downturn occurred from a level where the expected future returns from commodity index investment were reasonably good – and, as a spread above expected equity or bond returns, probably around the best levels ever.
But investors have a strong tendency to use the current level, rather than some esoteric measure of value, as the level from which expected market moves are evaluated. What I mean by that is this: in theory, if some event happens in the capital markets, the reaction in the market should depend on whether that event has already been “discounted” in the current price. That is, if we are all expecting Microsoft (NASDAQ:MSFT) to raise its dividend, then the price of Microsoft should reflect that change already, and when it subsequently actually happens it should have no effect on price. Indeed, if the market has overestimated the change in fundamental value, then the price of Microsoft should retrace somewhat when the news is actually announced. From that, we get the old saw that one should “buy the rumor, sell the news.”
The fact that this isn’t really what happens is not exactly news. In the early 1980s, Bob Shiller demonstrated that the volatility in the equity marketplace was much greater than the changes in the real underlying values should support.
In practice, investors don’t behave rationally. The same event can be discounted over, and over, and over again. Each investor, it seems, hears news and assumes the current price does not incorporate that news, no matter what has happened previously to the price. Based on my own unscientific observation, I think this is more true now that there are more retail investors, and news outlets that benefit from making everything sound like new information. If my supposition is true, one implication is that markets can deviate further and further from fundamental values. In other words, we get more bubbles and inverse bubbles than we would otherwise.
As a great current example, we might consider commodities. The slowdown in China’s economic activity is discounted anew almost every day, as more information comes out from that country that its economic engine is (at least) sputtering. One would think that China was the only consumer of industrial metals and energy, and that its consumption is going to zero, based on the behavior of these markets. And with every tick higher in the dollar, every commodity seems offered. It’s risk-off, then risk-off again, then risk-off again, ad infinitum.
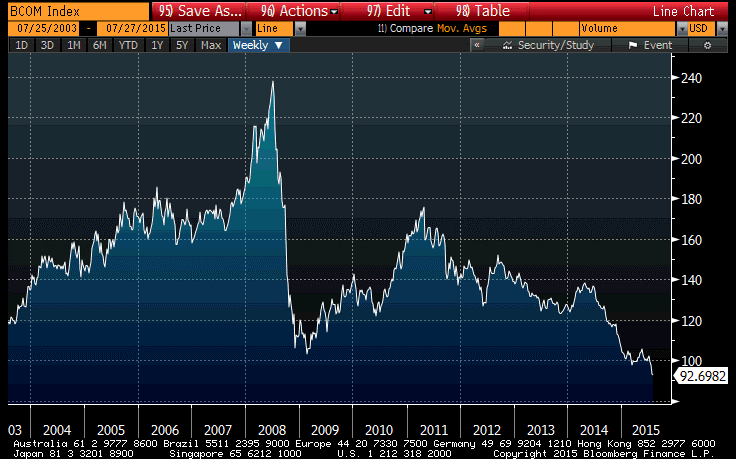
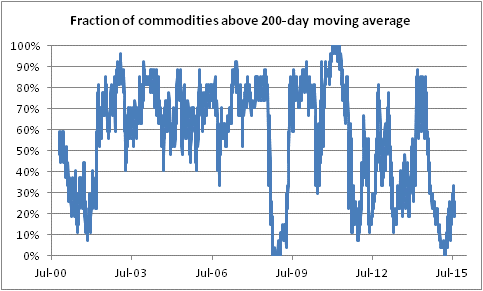
Now, there is no doubt that commodities in 2008 were overvalued, and arguably in 2011 they were also expensive. But the four-year beat-down of commodities – pretty much the only asset class that has declined in value over that time period – is breathtaking in its depth and, as it turns out, its breadth. I was curious about whether the recent break of major commodities indices to new lows – below the lows of 2008, when it felt like the world was ending (see chart above, source Bloomberg) – was broader, in that it seemed like every commodity was participating. So I put together a chart that shows the proportion of commodities (considering only the 27 major traded commodities that are in the Bloomberg Commodity Index) that were above their 200-day moving averages. The chart is below.
(Source: Enduring Investments)
It isn’t quite as bad as I had thought. The recent slide has taken the proportion back to 18% (meaning 82% are below their 200-day moving averages), but commodity prices have been sliding for so long that the 200-day averages are now generally declining pretty smartly. Notice in general the post-2011 average, compared to the pre-2008 average. Even without seeing the price chart, you can tell the 2011-2015 bear market from the 2002-2008 bull market!
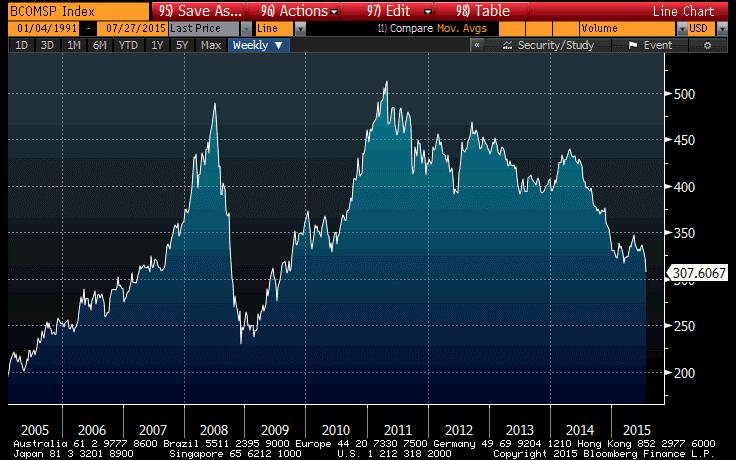
One other observation about commodities, to be fair. The chart I showed, above, of the Bloomberg Commodity Index, incorporates carry in commodities. That is, it adds the futures roll, and collateral return, to the movement in spot commodities. Over the last few years, the collateral return hasn’t been very good and the roll return has actually been substantially negative, so that the return of spot commodities has in fact been better than the return to commodity indices. The chart below (source: Bloomberg) shows the Bloomberg Spot Commodity Index; you can see that we are still above the 2008 lows.
Being “above the 2008 lows” doesn’t strike me as a strong performance. Stocks are also above the 2008-09 lows, by 200% or so. (ARCA:LQD), the investment-grade bond ETF, is about 45% higher. (ARCA:HYG), the high-yield ETF, is 41% higher. Heck, M2 money supply is around 50% higher than it was in early 2009.
And yet, every time we hear more news about China, investors behave as if it is new information, and sell commodities off some more. As I said above, these moves can last longer these days than they did in the past – but this is unsustainable. With commodities, an added complexity is that investors don’t know how to evaluate expected return (since there are no cash flows), and so it is hard for them to compare “value” to other asset classes. But the value is there.


