For nearly three years, we've contended that the price lows of December 2015 constituted a "bear market low" for COMEX Digital Silver. It now appears that this notion is about to be severely tested.
And now let's cut to the chase...
When the prices of COMEX gold and silver bottomed in late 2015, we thought at the time that this was due to price finding a "physical floor". Simply put, the price of the digital COMEX derivative was constrained by the reality of sourcing and delivering actual, physical metal at a price below the average cost of production.
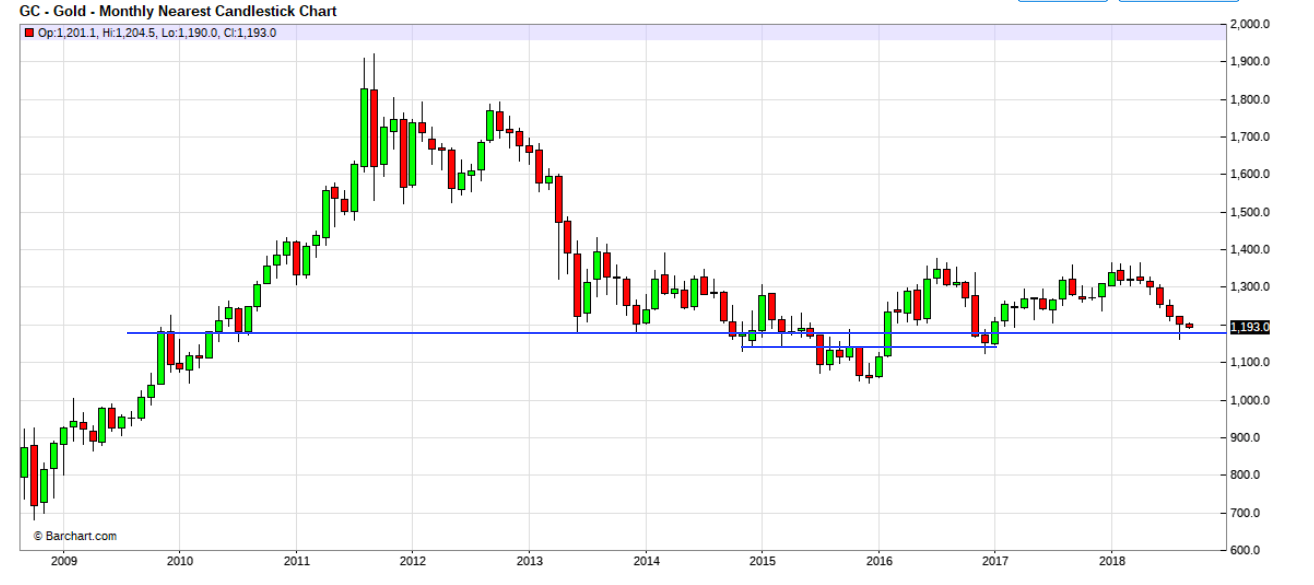
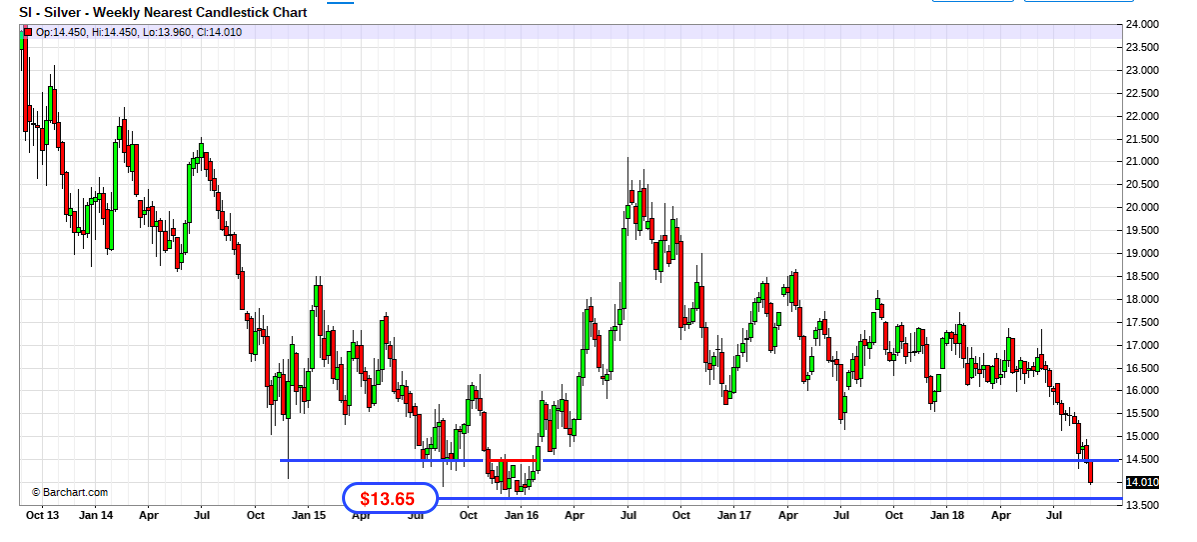
As such, the price of COMEX gold traded all the way down to $1050, with COMEX silver reaching $13.60 before a sharp rally developed in the first half of 2016... rallies that led to a 30% jump in COMEX gold and a 50% spike in COMEX silver.
And now here in September of 2018, prices are nearing these levels again, and many analysts are projecting that the same metrics which led to a bottom and bounce in 2015 will hold in 2018. Let's hope they're correct! However, as we've been reporting since June, there is one key difference between 2015 and 2018 that many are overlooking. The apparent yuan-gold "peg".
- The AISC (all-in-sustaining-cost) for many major metals producers has only risen since 2015, as energy costs have risen, too. If the AISC was $14 for silver in 2015, when crude was $35 barrel, what are the AISC in 2018, with crude at $70? And to that end, IF the PBOC is in fact taking steps to devalue precious metal against the dollar at the same rate they devalue the yuan, do you really think they give a rat's behind about the AISC of Barrick or Goldcorp?
- By any traditional measure, the latest Commitment of Traders reports are unabashedly bullish. "Speculators" are net short and "Commercials" are net long. This rarely-seen dynamic would seem to be a surefire bullish signal. However, if these extremes are only due to the aforementioned management of the "peg", then why would we expect a sudden trend change and reversal based solely upon traditional CoT analysis?
And consider this, too. In 2015, the global equity markets nearly collapsed after a 25% spike in the Dollar Index forced emerging market currency chaos. This then spread as a "contagion", and the S&P fell 12% in less than six days in August of that year. Though the equity markets soon magically recovered, the COMEX precious metal markets didn't bottom and recover until December.
Putting this all together, we must once again warn precious metal investors and traders to avoid "catching the falling knife". Though it may appear that price is near a physical floor... and though it may appear that the CoT positioning is near historic levels... and though it may appear that the charts look oversold... none of this will matter if the emerging markets continue to melt down and China continues its regime of devaluations against the US$. In this scenario, COMEX precious metal prices will continue lower, despite all traditional metrics.
Thus for now, keep an eye on these two charts. For COMEX gold, the key appears to once again be $1180. This has been a significant price level on many occasions since a low was found there in late June of 2013. Any break below on a weekly closing basis would indicate that a test of the December 2016 lows near $1140 was pending, and below there, the 2015 lows await.

And as mentioned above, the price break at $14.50 almost guarantees an imminent test of the December 2015 lows in COMEX silver. The key level to watch will be $13.63. Any weekly close below that level would be extraordinarily bearish, and it would place the next downside target somewhere near $12.

But let's conclude with a thought experiment that may allow us to close this dismal post on a more positive note...
Given that AISC have only risen since 2015, and given that major miners are already suffering and posting losses at $1300 gold, how many mining companies might be forced out of business at $1000 gold and $10 silver? Not only that, how would the resultant, significant drop in physical supply affect the physical market?? And if the physical market tightens past the levels of late 2015 and gets significantly worse, what will be the impact on the LBMA???
And so you see, this is where it could all get VERY interesting.
If China is intent upon driving commodity prices as low as required by the falling yuan, the distortions already inherent to the fraudulent COMEX/LBMA pricing scheme could worsen to levels which would make the system crack and crumble. AND THIS IS WHAT WE'VE ALL BEEN WAITING FOR!
How many times have we written about the day when delivery failures take down the COMEX and LBMA? How many times have we spoken of the unsustainability of the current pricing scheme and the game of musical chairs of alleged physical ownership, where there are more than 100 claims on every available, physical ounce?
Well, what would a paper price of $1000 do to The Banks, who would be on the hook to physically deliver gold at that price... at a time when the vaults are empty, unallocated accounts are unfunded and mine supply is dwindling?
And there you go. Finally, what we've all been waiting for. Total destruction of the NY/London Digital Gold Pool. And maybe this is all part of the master Chinese plan after all? Accumulate physical gold and then force a global reset in price that revalues your gold reserves (which you finally reveal to be 10X what you've stated in the past) multiple times higher. This also "revalues" your existing mountain of debt, it revives your currency by making it stronger and it allows you to ultimately offer some sort of reserve currency option against the US$.
Maybe that is where all of this is eventually headed? We'll have to wait and see, I guess. In the meantime, however, please understand that regardless of traditional metrics, the price situation will likely get worse before it gets better.
