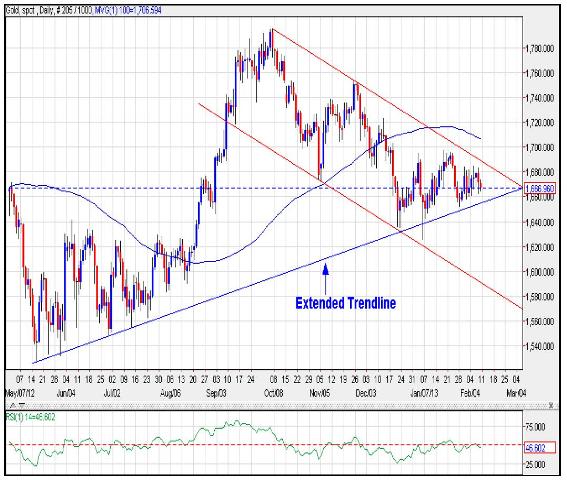
As shown in daily chart of Comex Gold, in the last week prices have formed inside bars and doji pattern and consolidated in the stiff range of 1660-1685. At the end of January 2013, we have observed three red candles and made a low of 1652. Afterwards, prices tried to move higher but it failed to cross the strong resistance of 1700 and moved sideways for 9 trading session constantly.
Generally, after an impulsive fall correction takes equal or two or three times to retrace it. Here, after an impulsive fall prices have taken 9 days against 3 days which is exactly three times and continued to sustain below the strong resistance level. This indicates the weakness in this commodity and we expect downtrend to resume very soon. In short, as long as 1690/1700 is intact on upside our bias is negative.
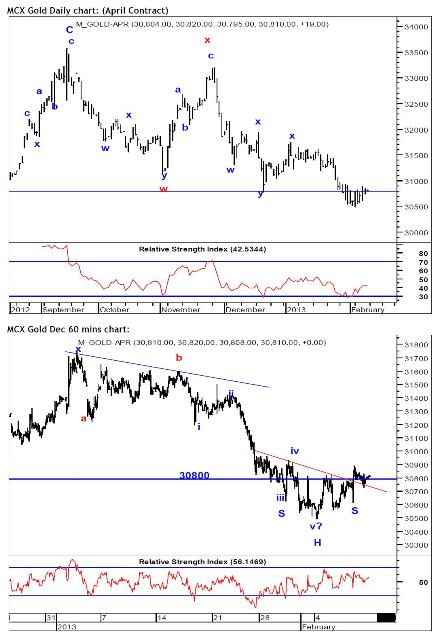
Move below 1660 will pull prices lower till the 1650/1645 levels over short term. As shown above in 60 mins chart, prices failed to move above the previous high of 30900 levels, tested the neckline of inverse Head and shoulder pattern (H&S) and made a low of 30725. Generally, MCX Gold moves parallel with Comex Gold.
However, rupee parity also plays an important role in MCX Gold price movement. We expect USDINR to bottom out and it should start the next leg on upside which has shown in currency report. This is positive for MCX Gold and it can restrict the down side movement in the coming trading session. Prices have also managed to hold the support of 30700 levels and tested the neckline of reversal pattern.
A move above 30900 will provide the first positive confirmation in MCX Gold. Therefore, it is imperative to see the price movement in the coming days which will decide the medium term view. In short, as long as 30700 are protected on downside our bias is positive for MCX Gold. Move above 30900 will push prices higher till 31100/31200. Nonetheless move below 30600 will take prices in negative territory.

- English (UK)
- English (India)
- English (Canada)
- English (Australia)
- English (South Africa)
- English (Philippines)
- English (Nigeria)
- Deutsch
- Español (España)
- Español (México)
- Français
- Italiano
- Nederlands
- Português (Portugal)
- Polski
- Português (Brasil)
- Русский
- Türkçe
- العربية
- Ελληνικά
- Svenska
- Suomi
- עברית
- 日本語
- 한국어
- 简体中文
- 繁體中文
- Bahasa Indonesia
- Bahasa Melayu
- ไทย
- Tiếng Việt
- हिंदी
Comex Gold Support At 1650 levels; MCX Gold Track Sideways
Published 02/12/2013, 01:33 AM
Updated 05/14/2017, 06:45 AM
Comex Gold Support At 1650 levels; MCX Gold Track Sideways
Latest comments
Loading next article…
Install Our App
Risk Disclosure: Trading in financial instruments and/or cryptocurrencies involves high risks including the risk of losing some, or all, of your investment amount, and may not be suitable for all investors. Prices of cryptocurrencies are extremely volatile and may be affected by external factors such as financial, regulatory or political events. Trading on margin increases the financial risks.
Before deciding to trade in financial instrument or cryptocurrencies you should be fully informed of the risks and costs associated with trading the financial markets, carefully consider your investment objectives, level of experience, and risk appetite, and seek professional advice where needed.
Fusion Media would like to remind you that the data contained in this website is not necessarily real-time nor accurate. The data and prices on the website are not necessarily provided by any market or exchange, but may be provided by market makers, and so prices may not be accurate and may differ from the actual price at any given market, meaning prices are indicative and not appropriate for trading purposes. Fusion Media and any provider of the data contained in this website will not accept liability for any loss or damage as a result of your trading, or your reliance on the information contained within this website.
It is prohibited to use, store, reproduce, display, modify, transmit or distribute the data contained in this website without the explicit prior written permission of Fusion Media and/or the data provider. All intellectual property rights are reserved by the providers and/or the exchange providing the data contained in this website.
Fusion Media may be compensated by the advertisers that appear on the website, based on your interaction with the advertisements or advertisers.
© 2007-2025 - Fusion Media Limited. All Rights Reserved.
