
Have you been eager to see how Comerica Incorporated (NYSE:CMA) performed in Q4 in comparison with the market expectations? Let’s quickly scan through the key facts from this Texas-based money center bank’s earnings release this morning:
An Earnings Beat
Comerica came out with adjusted earnings per share of $1.28, beating the Zacks Consensus Estimate of $1.21. Higher revenues and lower provisions were primarily responsible for earnings beat. Also, ease in margin pressure supported the results.
How Was the Estimate Revision Trend?
You should note that the earnings estimate for Comerica depicted neutral stance prior to the earnings release. The Zacks Consensus Estimate remained stable over the last seven days.
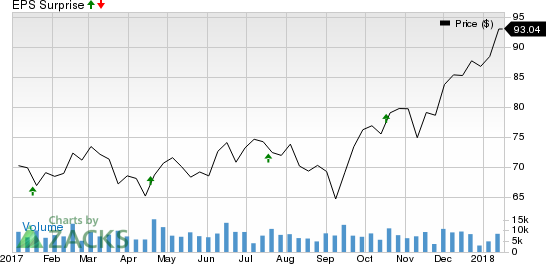
However, Comerica has an impressive earnings surprise history. Before posting earnings beat in Q4, the company delivered positive surprises in all the trailing four quarters. Overall, the company surpassed the Zacks Consensus Estimate by an average of 10.1% in the trailing four quarters.
Comerica Incorporated Price and EPS Surprise
Revenue Came In Higher Than Expected
Comerica posted revenues of $830 million, which easily surpassed the Zacks Consensus Estimate of $819.6 million. Also, it compared favorably with the year-ago number of $722 million.
Key Stats to Note:
- Fourth quarter and full-year 2017 results were impacted by a $107 million charge to adjust deferred taxes as a result of the Tax Cuts and Jobs Act
- Net Interest Margin: 3.28% up 63 basis points year over year
- Provision for credit losses: $17 million, down 51.4% on a year over year basis
- Non-interest expenses: $483 million, up 4.8% on a year over year basis
What Zacks Rank Says
The estimate revisions that we discussed earlier have driven a Zacks Rank #1 (Strong Buy) for Comerica. However, since the latest earnings performance is yet to be reflected in the estimate revisions, the rank is subject to change. While things apparently look favorable, it all depends on what sense the just-released report makes to the analysts.
(You can see the complete list of today’s Zacks #1 Rank stocks here.)
Check back later for our full write up on this Comerica earnings report!
Today's Stocks from Zacks' Hottest Strategies
It's hard to believe, even for us at Zacks. But while the market gained +18.8% from 2016 - Q1 2017, our top stock-picking screens have returned +157.0%, +128.0%, +97.8%, +94.7%, and +90.2% respectively.
And this outperformance has not just been a recent phenomenon. Over the years it has been remarkably consistent. From 2000 - Q1 2017, the composite yearly average gain for these strategies has beaten the market more than 11X over. Maybe even more remarkable is the fact that we're willing to share their latest stocks with you without cost or obligation.
See Them Free>>
Comerica Incorporated (CMA): Free Stock Analysis Report
Original post
Zacks Investment Research