One of my primary focuses on Scott’s Investments is studying and tracking various market-timing, trading, and portfolio strategies. However, no matter how well a strategy tests historically there is always the possibility a strategy under-performs in the future. One way to mitigate this risk is to diversify strategies within a portfolio, and not just securities.
The tests below were conducted using Stockscreen123 (an off-shoot of Portfolio123). The tests use a combination of two market timing strategies.
The first timing strategy is a “Equities vs. Fixed Income” strategy, which purchases one core equity ETF, the S&P 500 SPDR (SPY) when conditions are deemed bullish, and a core fixed-income ETF, the iShares Barclay 20-year Treasury ETF (TLT), when conditions are deemed bearish. The timing model assumes conditions are favorable for equity investing if EPS estimates are rising and if valuations are reasonable.
- The estimates test is whether the 5-week moving average of the aggregate of the consensus current-year estimates for S&P 500 companies is above the 21-week moving average.
- The valuation test is based upon risk premium, specifically, whether the S&P 500 risk premium (earnings yield minus 10-year treasury yield) is above 1%
While more often than not both strategies share the same signal (i.e. going long SPY), there are times when mixed signals are sent so the hypothetical portfolio goes long both SPY and TLT simultaneously.
For a free 10 page education trading article from Chris Vermeleun click here (clicking the link will automatically download the pdf).
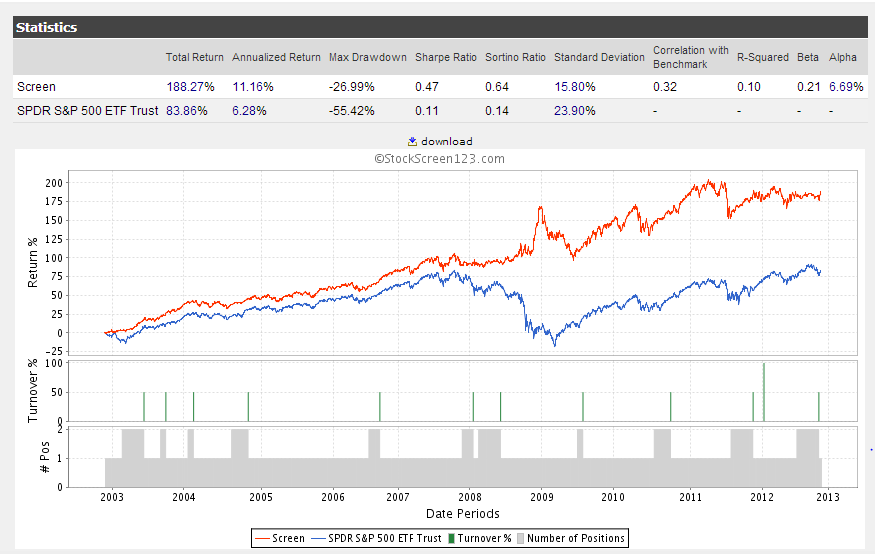
Below is the results of a 10 year backtest with a 4 week rebalance period, compared to SPY (in blue). Dividends are included but no commissions, taxes, or slippage is assumed:

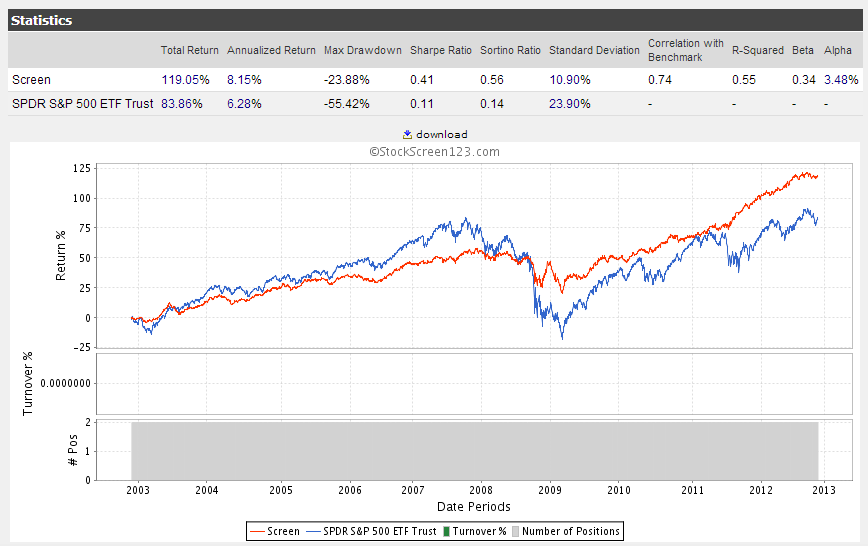
What if an investor purchased an equal weight portfolio in SPY and TLT 10 years ago and rebalanced annually? The total returns are lower than the combined market timing system but higher than SPY. Standard deviation and max drawdown of the equal weight SPY/TLT portfolio is lower than the combined market timing system and SPY:

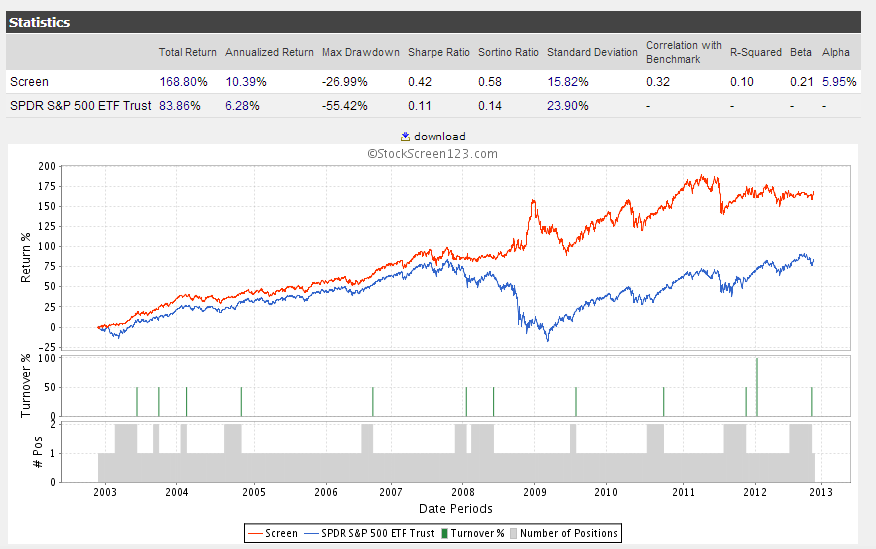
What if we incorporate 0.5% slippage into the combined market timing system? Slippage helps accounts for bid/ask spreads that exist in real-world trading and potential commissions. Total returns decrease but the results are still solid, which is not surprising given that the system only uses two securities and rebalances every 4 weeks:

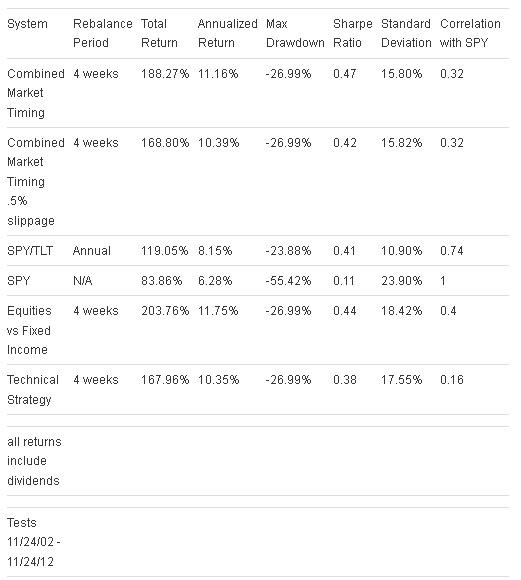
Below are the test results in table format. The trading systems by themselves are also included. As you can see, both trading systems test well as a stand-alone system, but the highest sharpe ratio is achieved when combining the two systems:

The two market timing systems presented here are not intended as optimal timing systems – better options may exist for investors. However, the two systems are easy to implement for an individual investor and as stand-alone systems have strong historical results. When combined into a single portfolio the two strategies have led to even better risk-adjusted returns (as gauged by Sharpe Ratio) even when compared to an equal-weight SPY/TLT portfolio.
Disclaimer: Stock Loon LLC, Scott's Investments and its author is not a financial adviser. Stock Loon LLC, Scott's Investments and its author does not offer recommendations or personal investment advice to any specific person for any particular purpose. Please consult your own investment adviser and do your own due diligence before making any investment decisions.
