Coinstar, Inc. (CSTR) is a provider of automated retail solutions. Coinstar’s core offerings in automated retail include its digital video disk (DVD) business, where consumers can rent or purchase movies from self-service kiosks (DVD Services segment), and its Coin business, where consumers can convert their coin to cash or stored value products at coin-counting self-service kiosks (Coin Services segment).
The news that pushed CSTR stock up (and the vol down) is earnings and the acquisition of a competitor. Here’s a news snippet:
"SAN FRANCISCO (MarketWatch) -- Shares of Coinstar Inc.jumped more than 16% to $58.90 on Tuesday morning after the company reported better-than-expected results for the fourth quarter and announced plans to buy the DVD-kiosk business from NCR Corp. -- removing a key competitor for Coinstar's Redbox service. The deal came after Coinstar announced a partnership with Verizon for a new digital streaming service"
Source: MarketWatch via Yahoo! Finance – Coinstar shares jump on results, NCR deal, written by Dan Gallagher.
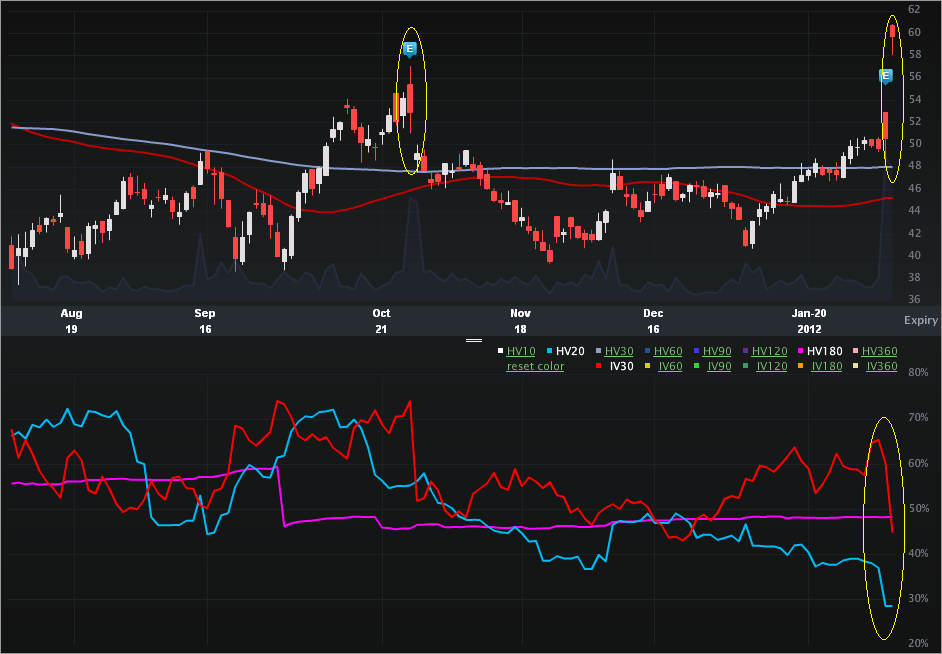
Well that seems pretty good… Like 18% up good news. Let’s turn to the Charts Tab (six months), below.
On the stock side, we can see how CSTR has now gapped in both of the last two earnings reports. Last time it was a 7.0% drop down. Today, it’s an 18% pop up.
On the vol side we can see the awesome drop in implied off of earnings – a perfectly normal and predictable phenomenon, but cool nonetheless. The implied is now trading right around the long-term historical realized vol (HV180™). Keep in mind that HV is calculated close-to-close, so that blue line (HV20™) will pop on tomorrow’s chart.
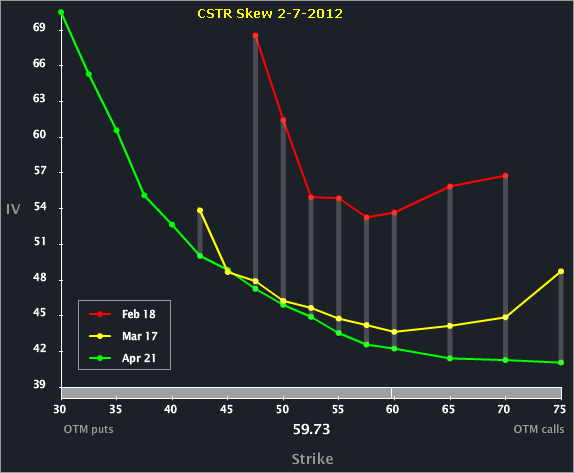
Let’s turn to the Skew Tab.
We can see that while the vol has imploded today, the front is still substantially elevated to the back months. It’s also nice to see that the front two expiries have an upside skew bend as well – so parabolic in totality. It’s possible that the upside skew may come down in the next few days (or hours) after the revelation of this earnings report is fully digested into the equity price.
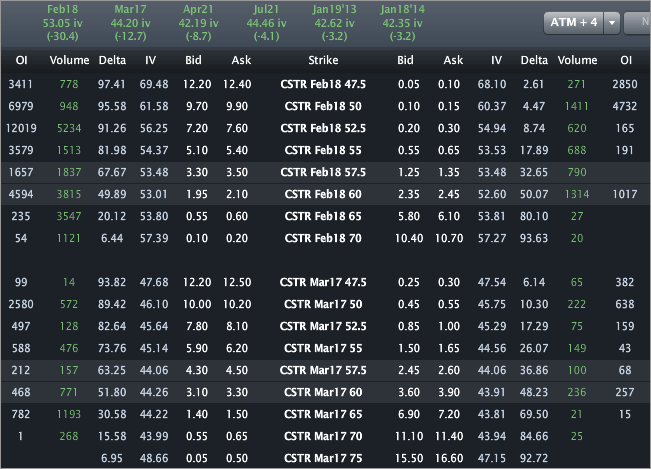
Finally, let’s turn to the Options Tab, for completeness.
I wrote about this one for TheStreet (OptionsProfits), so no specific trade analysis here. We can see that Feb is still priced to 53% vol, while Mar is down to 44%. Looking with a bit more care and a specific example, we can see the Feb 57.5 puts are priced to 53.48% while those same puts in Mar are priced to 43.82%. In dollar terms, the Feb 57.5 puts are priced to half of the value of the mar 57.5 puts.
Let’s keep in mind:
Mar puts
= Feb puts + the rest of mar expo not in Feb.
= ~2 weeks + 4 weeks
Of course, that premium for the next two weeks is largely concentrated in the next few hours -- i.e. the trade day. It will be interesting to see where the vol goes in Feb in the next day or so. For that matter, it will be interesting to see where the stock goes as well.
This is trade analysis, not a recommendation.
- English (UK)
- English (India)
- English (Canada)
- English (Australia)
- English (South Africa)
- English (Philippines)
- English (Nigeria)
- Deutsch
- Español (España)
- Español (México)
- Français
- Italiano
- Nederlands
- Português (Portugal)
- Polski
- Português (Brasil)
- Русский
- Türkçe
- العربية
- Ελληνικά
- Svenska
- Suomi
- עברית
- 日本語
- 한국어
- 简体中文
- 繁體中文
- Bahasa Indonesia
- Bahasa Melayu
- ไทย
- Tiếng Việt
- हिंदी
CoinstarStock Explodes, Vol Implodes Off of Earnings -- Now What?
Published 02/07/2012, 11:42 PM
Updated 07/09/2023, 06:31 AM
CoinstarStock Explodes, Vol Implodes Off of Earnings -- Now What?
Latest comments
Loading next article…
Install Our App
Risk Disclosure: Trading in financial instruments and/or cryptocurrencies involves high risks including the risk of losing some, or all, of your investment amount, and may not be suitable for all investors. Prices of cryptocurrencies are extremely volatile and may be affected by external factors such as financial, regulatory or political events. Trading on margin increases the financial risks.
Before deciding to trade in financial instrument or cryptocurrencies you should be fully informed of the risks and costs associated with trading the financial markets, carefully consider your investment objectives, level of experience, and risk appetite, and seek professional advice where needed.
Fusion Media would like to remind you that the data contained in this website is not necessarily real-time nor accurate. The data and prices on the website are not necessarily provided by any market or exchange, but may be provided by market makers, and so prices may not be accurate and may differ from the actual price at any given market, meaning prices are indicative and not appropriate for trading purposes. Fusion Media and any provider of the data contained in this website will not accept liability for any loss or damage as a result of your trading, or your reliance on the information contained within this website.
It is prohibited to use, store, reproduce, display, modify, transmit or distribute the data contained in this website without the explicit prior written permission of Fusion Media and/or the data provider. All intellectual property rights are reserved by the providers and/or the exchange providing the data contained in this website.
Fusion Media may be compensated by the advertisers that appear on the website, based on your interaction with the advertisements or advertisers.
© 2007-2025 - Fusion Media Limited. All Rights Reserved.
