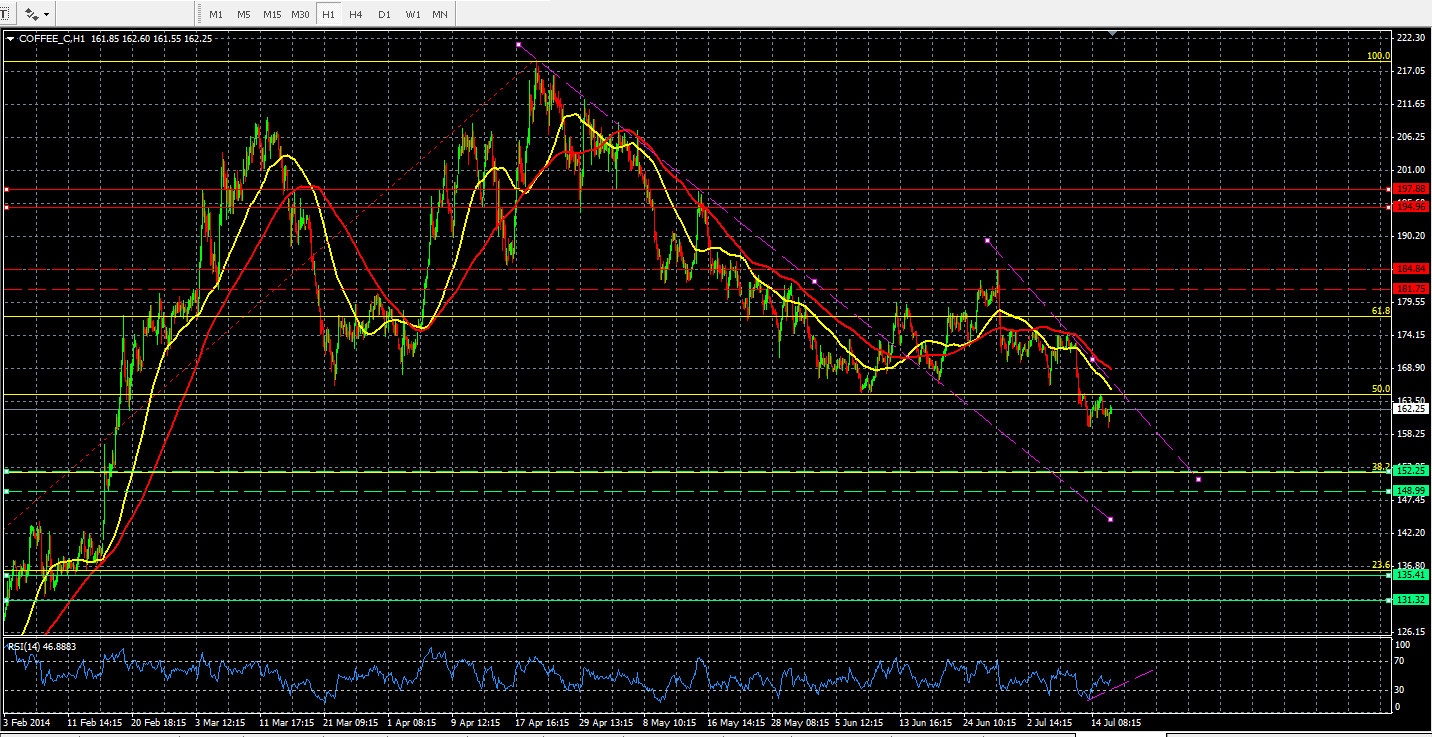
Coffee is trading below the downward trend line on a 60 minute time frame. The commodity had a false breakout when it broke its first downward trend line and failed to break its minor resistance. The trading of the price below the downward trend line certainly confirms the downward trend is intact and unless we break this trend line towards the upside, the bias could be towards the downside.
The price is also trading below the 50day (shown in yellow) and the 100 day (shown in red) moving average. Moving averages are the best way to determine the trend of the price and if they slope downward and the price is trading below them, this confirms the directions of the trend is towards the downside. The further away the price is trading from its moving average, it increases the odds of trend correction.
The famous Fibonacci ratio is nicely lined up with our minor support level and this where the price has left in a very ballistic way towards the upside thus it represents that there may be big orders waiting there. A break of this support zone and violation of 38% Fibonacci retracement usually confirms that the price is going to complete its full cycle.
The RSI is showing a clear sign of negative divergence. A negative divergence takes place when the price is making a lower low, but the RSI fails to confirm that in other words the RSI makes the higher low.

Support Zone
135-131 Major
152-148 Minor
Resistance Zone
197-194- Major
184-181 Minor
Disclaimer: The above is for informational purposes only and NOT to be construed as specific trading advice. responsibility for trade decisions is solely with the reader.
by Naeem Aslam
