Coffee Exporters May Reduce Shipping
Brazil's drought could have a negative effect on coffee yield. Will the Robusta quotations grow?

The Indian Coffee Exporters Association does not rule out that Robusta coffee makers may slightly reduce coffee shipments from India in anticipation of more accurate crop estimates and a possible increase in quotations. Last week, the Honduran Coffee Institute published a forecast for a decline in coffee exports from Honduras in the 2019/20 season by 4.6% to 6.6 million bags of 60 kg. At the same time, the area under coffee in Honduras may be reduced by 5.2%.
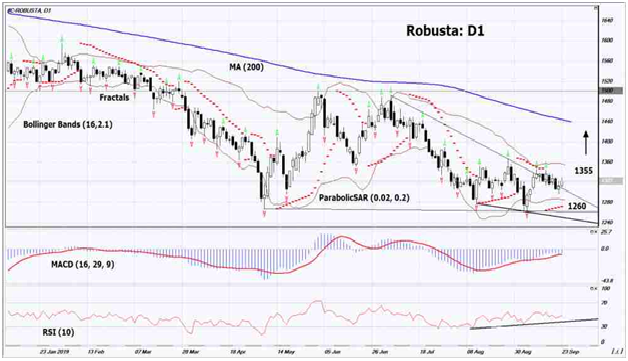
On the daily timeframe Robusta: D1 adjusts upward from the bottom line of the wide neutral range. Various technical analysis indicators have generated signals to increase. Further growth of quotations is possible in case of decrease in world production and with an increase in demand.
- The Parabolic indicator gives a signal to increase.
- The Bollinger bands® narrowed, indicating low volatility.
- The RSI indicator is above the mark of 50. It has formed a divergence to increase.
- The MACD indicator gives u bullish signal.
The bullish momentum may develop if Robusta exceeds the last two upper fractals and the upper Bollinger line: 1355. This level can be used as an entry point. The initial stop lose may be placed below the last lower fractal, the minimum since March 2010, the lower Bollinger line and the Parabolic signal: 1260. After opening a pending order, stop shall be moved following Bollinger and Parabolic signals to the next fractal minimum. Thus, we are changing the potential profit/loss to the breakeven point. More risk-averse traders may switch to the 4-hour chart after the trade and place a stop loss moving it in the direction of the trade. If the price meets the stop level (1260) without reaching the order (1355), we recommend to cancel the order: the market sustains internal changes that were not taken into account.
Technical Analysis Summary
Position Buy
Buy stop Above 1355
Stop loss Below 1260
