The price of the cocoa future fell for the entire trading year of 2016. Now a floor may have formed in cocoa, at least in the medium term. Several factors suggest this:
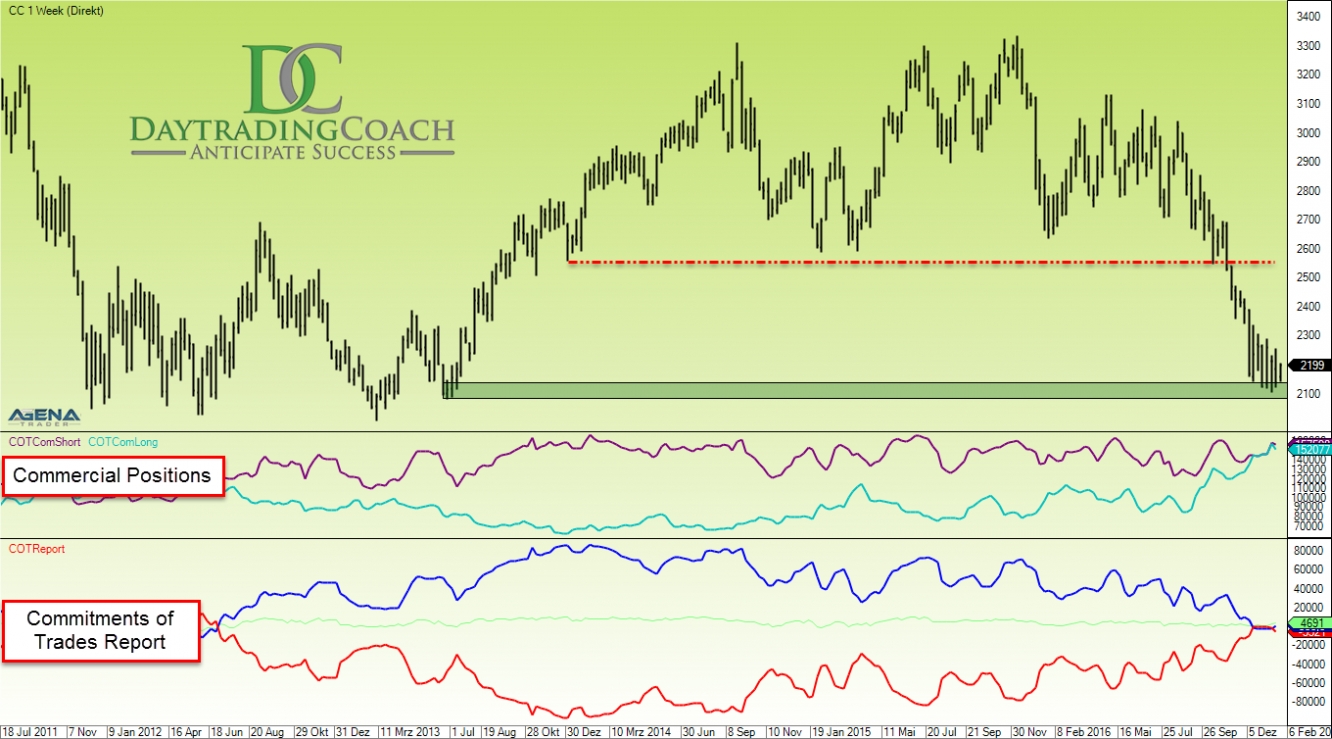
In the first image (weekly chart) we see very clearly that the price of cacao has arrived in the strong support area from mid-2013, and has been unable to break through this area for 6 weeks now. Below the chart course are, in order of depiction, the long and short positions of the commercials, and the classic COT report, i.e. the net positions of commercials (red), large speculators (blue) and small speculators (green).
The commercials (hedgers) have, in the meantime, amassed historically large long positions; the large speculators (funds), on the other hand, are positioned more heavily short than they have been for four years. Both extreme values indicate that we should see a larger movement in the northerly direction in cacao in the near future. The last strong support area was broken during the downwards movement at approx. 2550. This could be the mid-term price target for a long movement. 
Chart: AgenaTrader
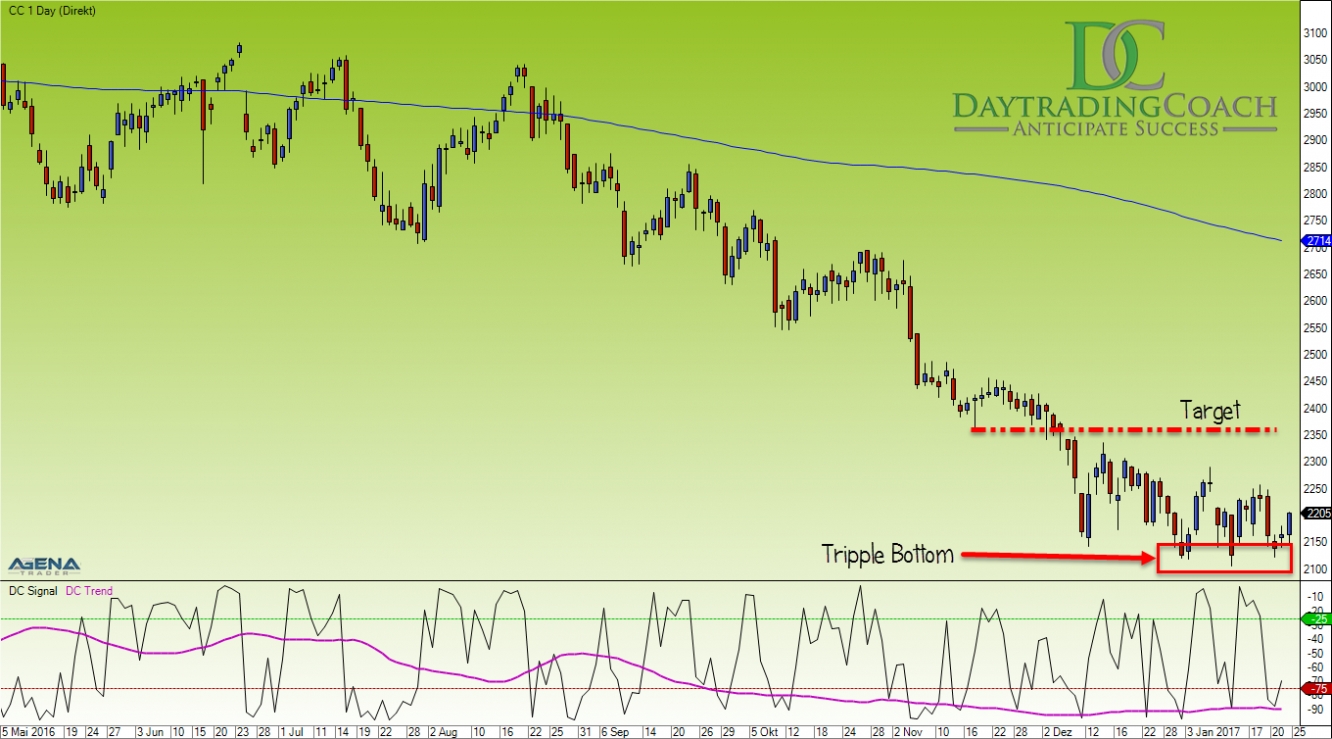
In the daily chart, too, the current movement of the prices also very much appears as if a bottom formation is in the works in the cacao future. Here we can already see a triple bottom, a classic reversal formation from chart technique. With a breakout above the last high at approx. 2260, this formation would then be completed.
Using my indicators DC trend and DC signal, we can see that although the trend is still clearly facing downwards, the signal line is currently still in the lower area, that is to say more at a buy level. The target area in the daily chart, however, is located a little lower than in the weekly chart. The first area of resistance, and therefore the first price target for a long movement here, is 2350 – the area of the last significant low of the downward sequence. 
Chart: AgenaTrader
Now all that remains is the question of the entry level. Due to the first resistance at 2350, the relatively clear formation of the triple bottom and the good chance-to-risk ratio when buying at the current price, I consider an entry at the current level acceptable.
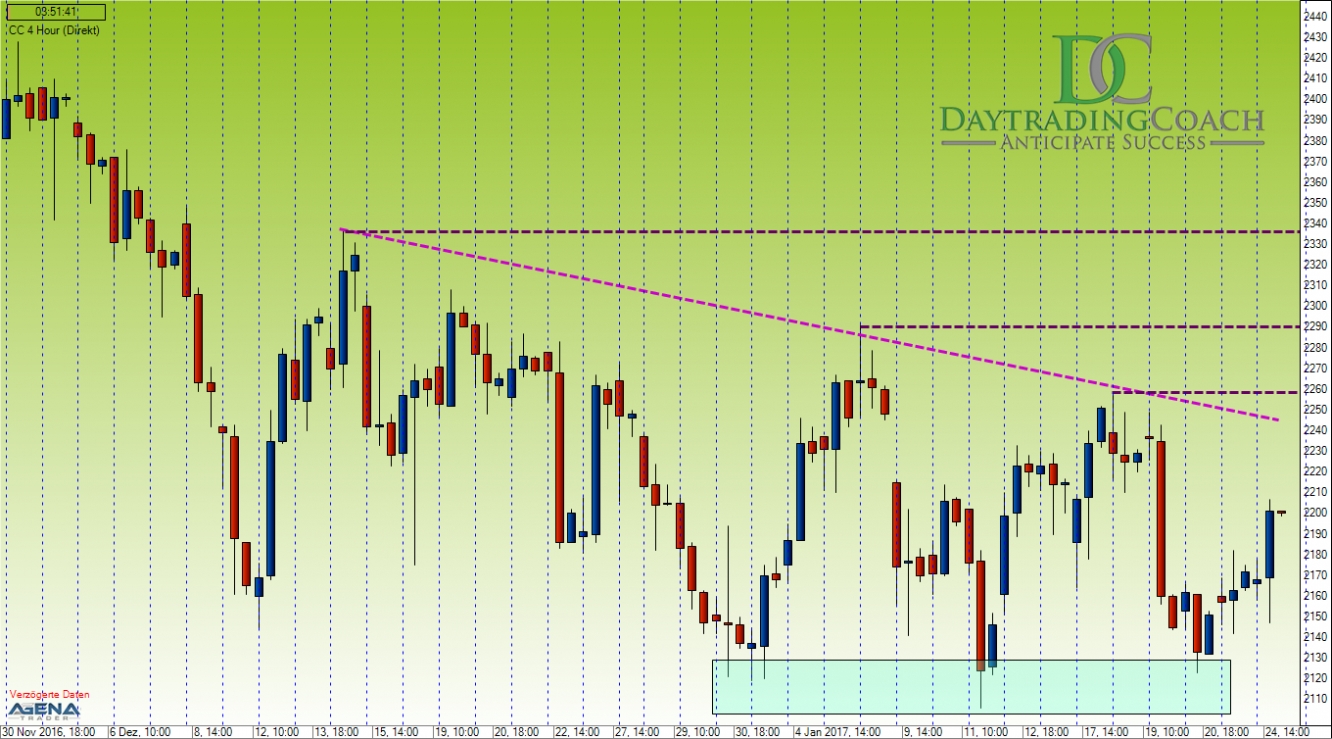
Anyone who prefers to wait for confirmation can, in this case, also wait to see whether the triple bottom is confirmed in the 4-hour chart and then buy on a breakout above the pink downward trend line in the 4-hour chart, or also wait for the price to overcome the high at 2260. The stop would then have to be placed beneath the last candle that had broken through the corresponding level.

Chart: AgenaTrader
Short-term long trades can be established until just into the target area of the correction at 2350. After that, the 2550 will then come into play. Therefore whenever you want to enter into a position, make sure that you are trading with the advantage and that a good chance-to-risk ratio is being offered.
Until next time, I wish you continued successful trades.
Disclaimer: Exchange transactions are associated with significant risks. Those who trade on the financial and commodity markets must familiarize themselves with these risks. Possible analyses, techniques and methods presented here are not an invitation to trade on the financial and commodity markets. They serve only for illustration, further education, and information purposes, and do not constitute investment advice or personal recommendations in any way. They are intended only to facilitate the customer's investment decision, and do not replace the advice of an investor or specific investment advice. The customer trades completely at his or her own risk.
