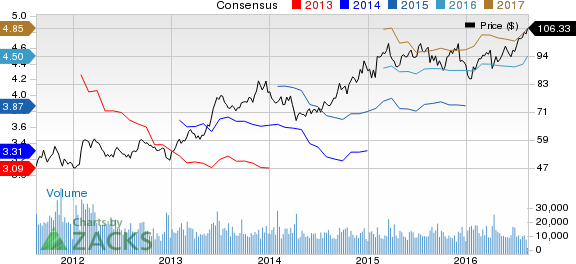
On Aug 18, 2016, shares of CME Group Inc. (NASDAQ:CME) reached a 52-week high of $106.33 driven by strong second-quarter 2016 results. About 0.8 million shares exchanged hands in the last trading session and the stock finally closed at $106.33, up 0.49%. Year to date, the stock has returned 17.35%, which is substantially above 11.74% returned by Nasdaq.
CME Group, in the second quarter, delivered operating earnings per share of $1.14 that surpassed the Zacks Consensus Estimate by 2.70%. The bottom line also improved 15.2% year over year on record average daily volumes (ADV). A record 15.1 million contracts reflected a 13% year-over-year increase. Notably, the company also achieved quarterly record in agricultural commodities. Total average rate per contract inched up 0.6% to 78.2 cents. In fact, ADV improved to 14.1 million contracts per day in July, up 10% year over year.
This Zacks Rank #2 (Buy) securities exchange delivered positive surprises in three of the last four quarters, with an average beat of 2.25%.
Top line too improved 10.5% to a record $906.4 million, driven by 12.6% higher clearing and transaction fees and 3.7% increase in access and communication fees.
Additionally, its open interest reached an all-time high of more than 116 million contracts. This reflects an increased reliance of market participants on CME Group.
CME Group became the first exchange to offer swaptions clearing during the second quarter. This service is aimed to enable clients to obtain greater operational and capital efficiencies from clearing.
In order to help producers and commercial firms to manage their price risk, CME Group undertook initiatives to improve Live Cattle futures markets this August.
Backed by solid earnings, the Zacks Consensus Estimate moved north as most of the estimates were revised higher over the last 30 days. The same increased 3.2% to $4.50 for 2016 and 3% to $4.85 for 2017. The expected long term earnings growth is currently pegged at 9.7%.
Other Stocks to Consider
Investors interested in finance sector can also consider stocks like MarketAxess Holdings Inc. (NASDAQ:MKTX) , Bats Global Markets (NYSE:BATS) and Allied World Assurance Company Holdings, AG (NYSE:AWH) . While MarketAxess and Allied World Assurance sport a Zacks Rank #1 (Strong Buy), Bats Global holds a Zacks Rank #2 (Buy).
ALLIED WORLD AS (AWH): Free Stock Analysis Report
CME GROUP INC (CME): Free Stock Analysis Report
MARKETAXESS HLD (MKTX): Free Stock Analysis Report
BATS GLOBAL MKT (BATS): Free Stock Analysis Report
Original post
Zacks Investment Research

