Interest rate markets
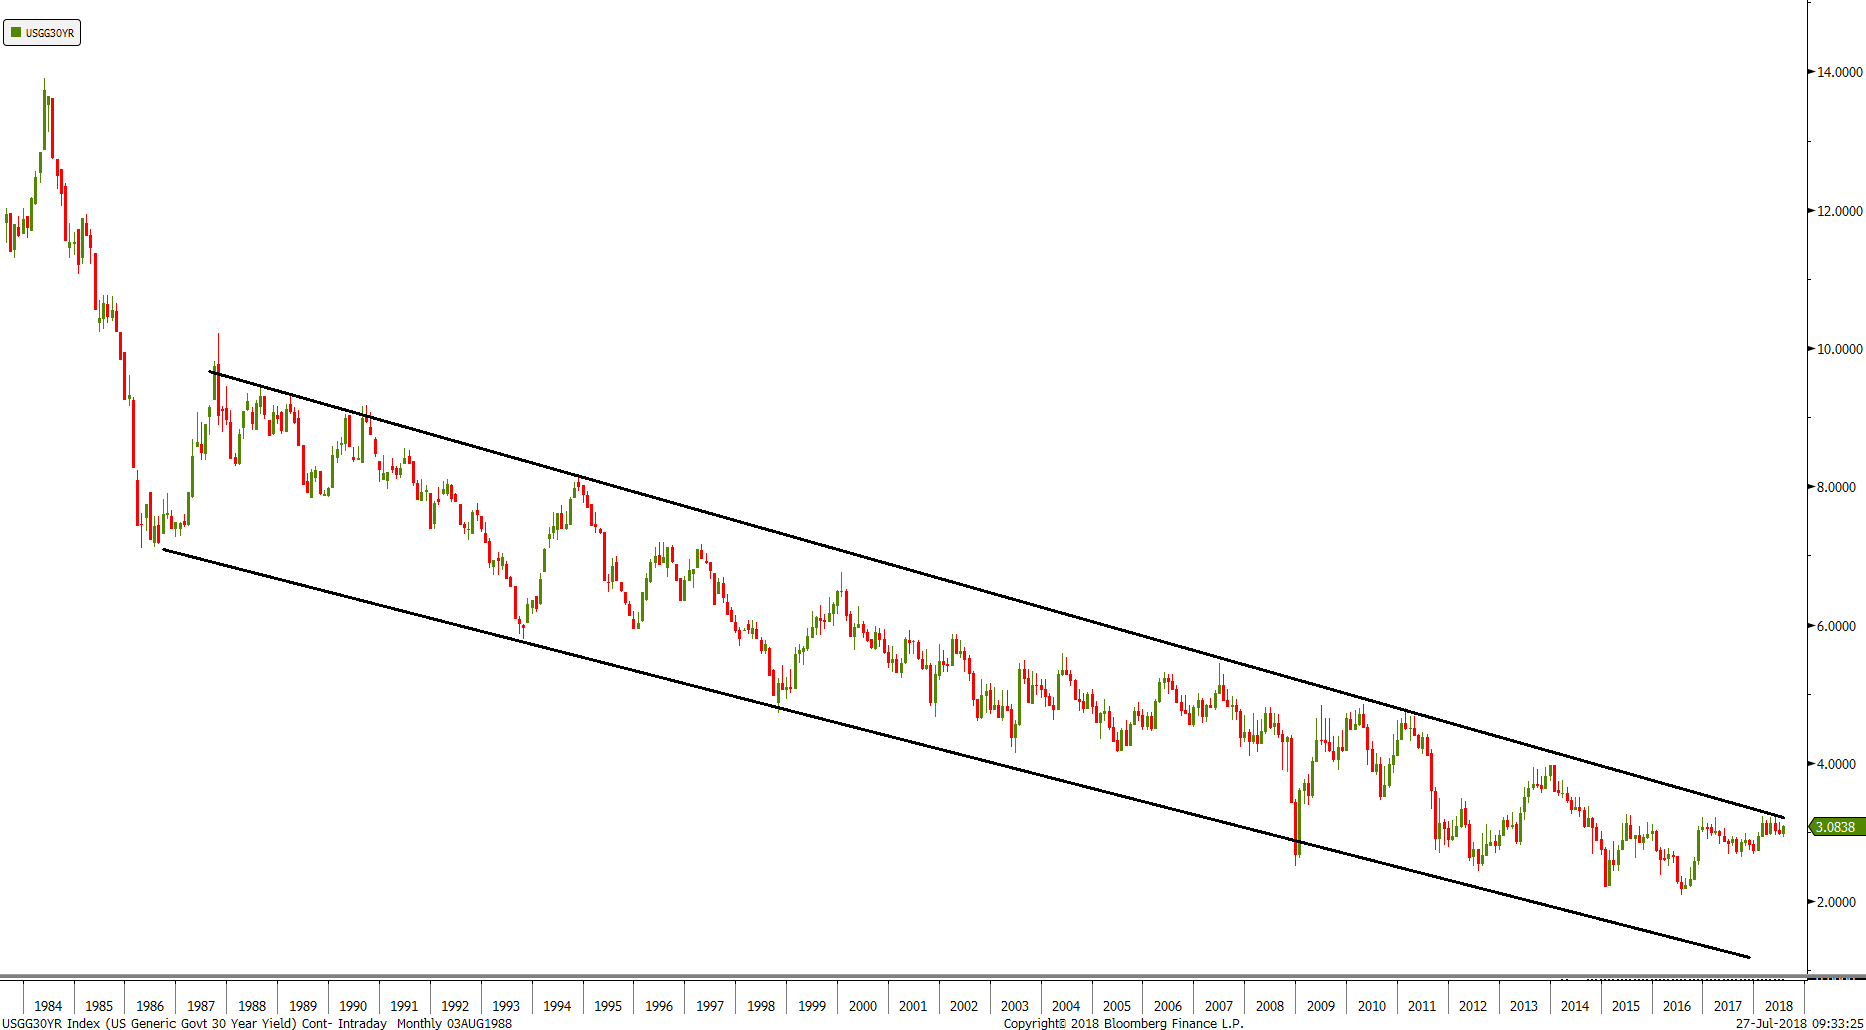
U.S. interest rates have experienced a generational low. The long-term trend is toward higher rates (lower prices).
Treasury Markets – T-Notes
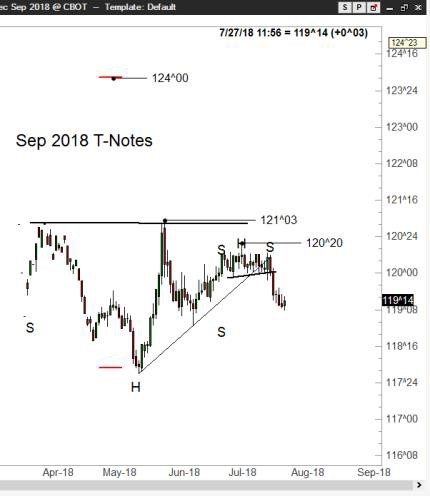
The COT profile is at all-time record extremes in terms of Commercial long and Spec short positions. The daily chart displays a 6-month bottom. While I am a long-term bear on Treasury prices (bull on yields), the COT profile and daily chart suggest a sharp rally could be in the works. I will monitor this market for a buying opportunity.
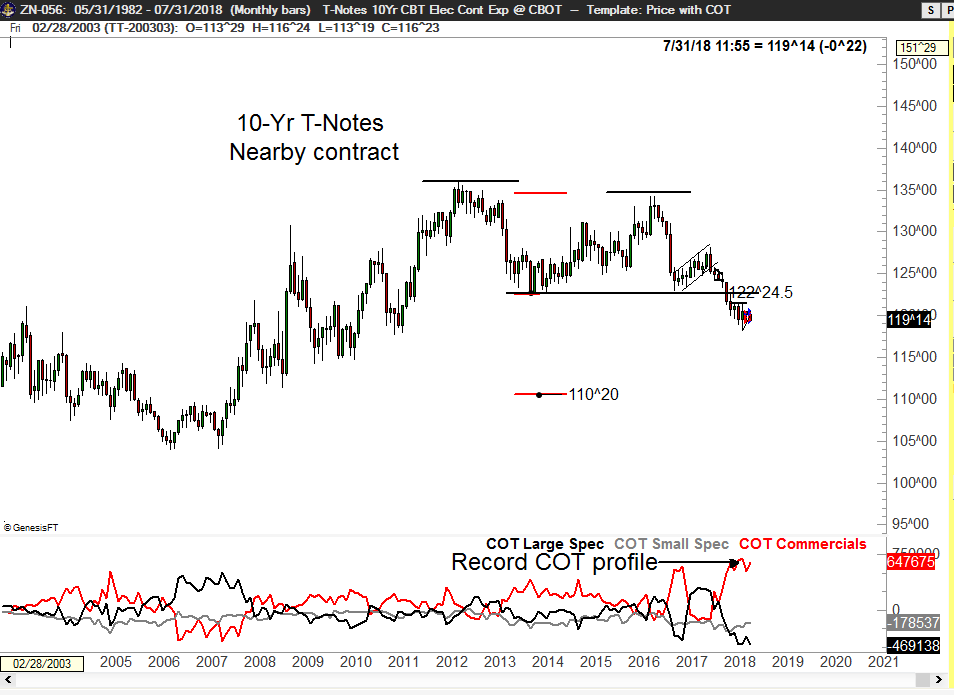
A rally by the nearby contract to 122^24 would retest the double top on the monthly graph.
Treasury Markets – T-Bonds
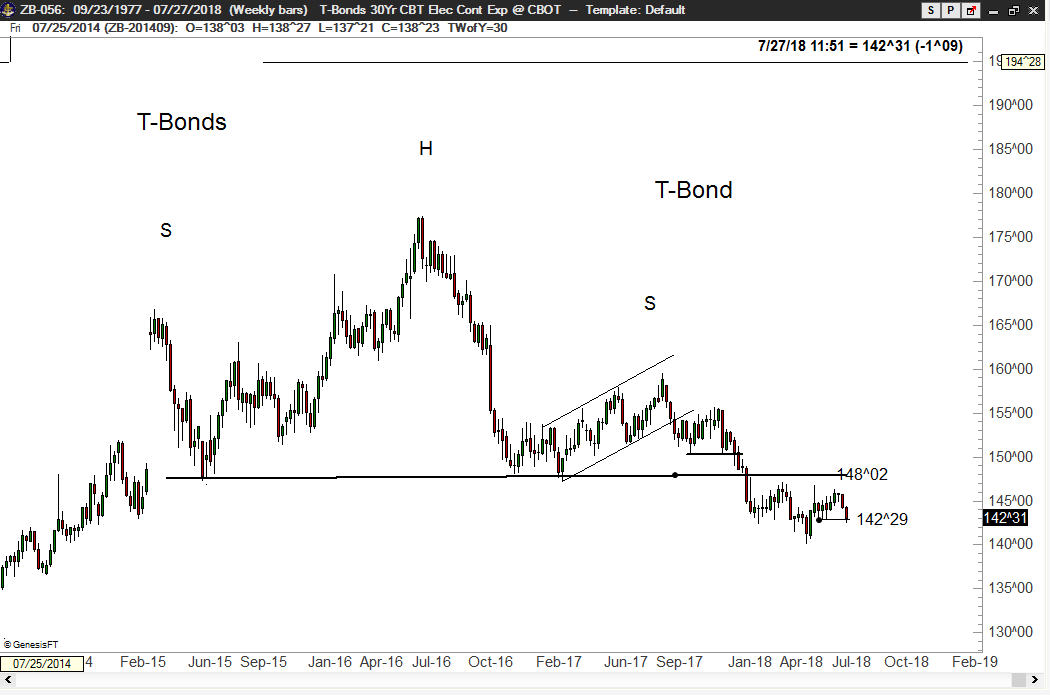
A rally on the monthly futures graph to 148^00 would be a retest of the overhead H&S pattern. The daily chart displays a possible inverted H&S bottom. This chart would suggest an advance to 152^00 – and that would go a long way to negate the H&S top on the weekly graph. The monthly T-Bond yield chart (next page) shows that the multi-decade channel remains intact.
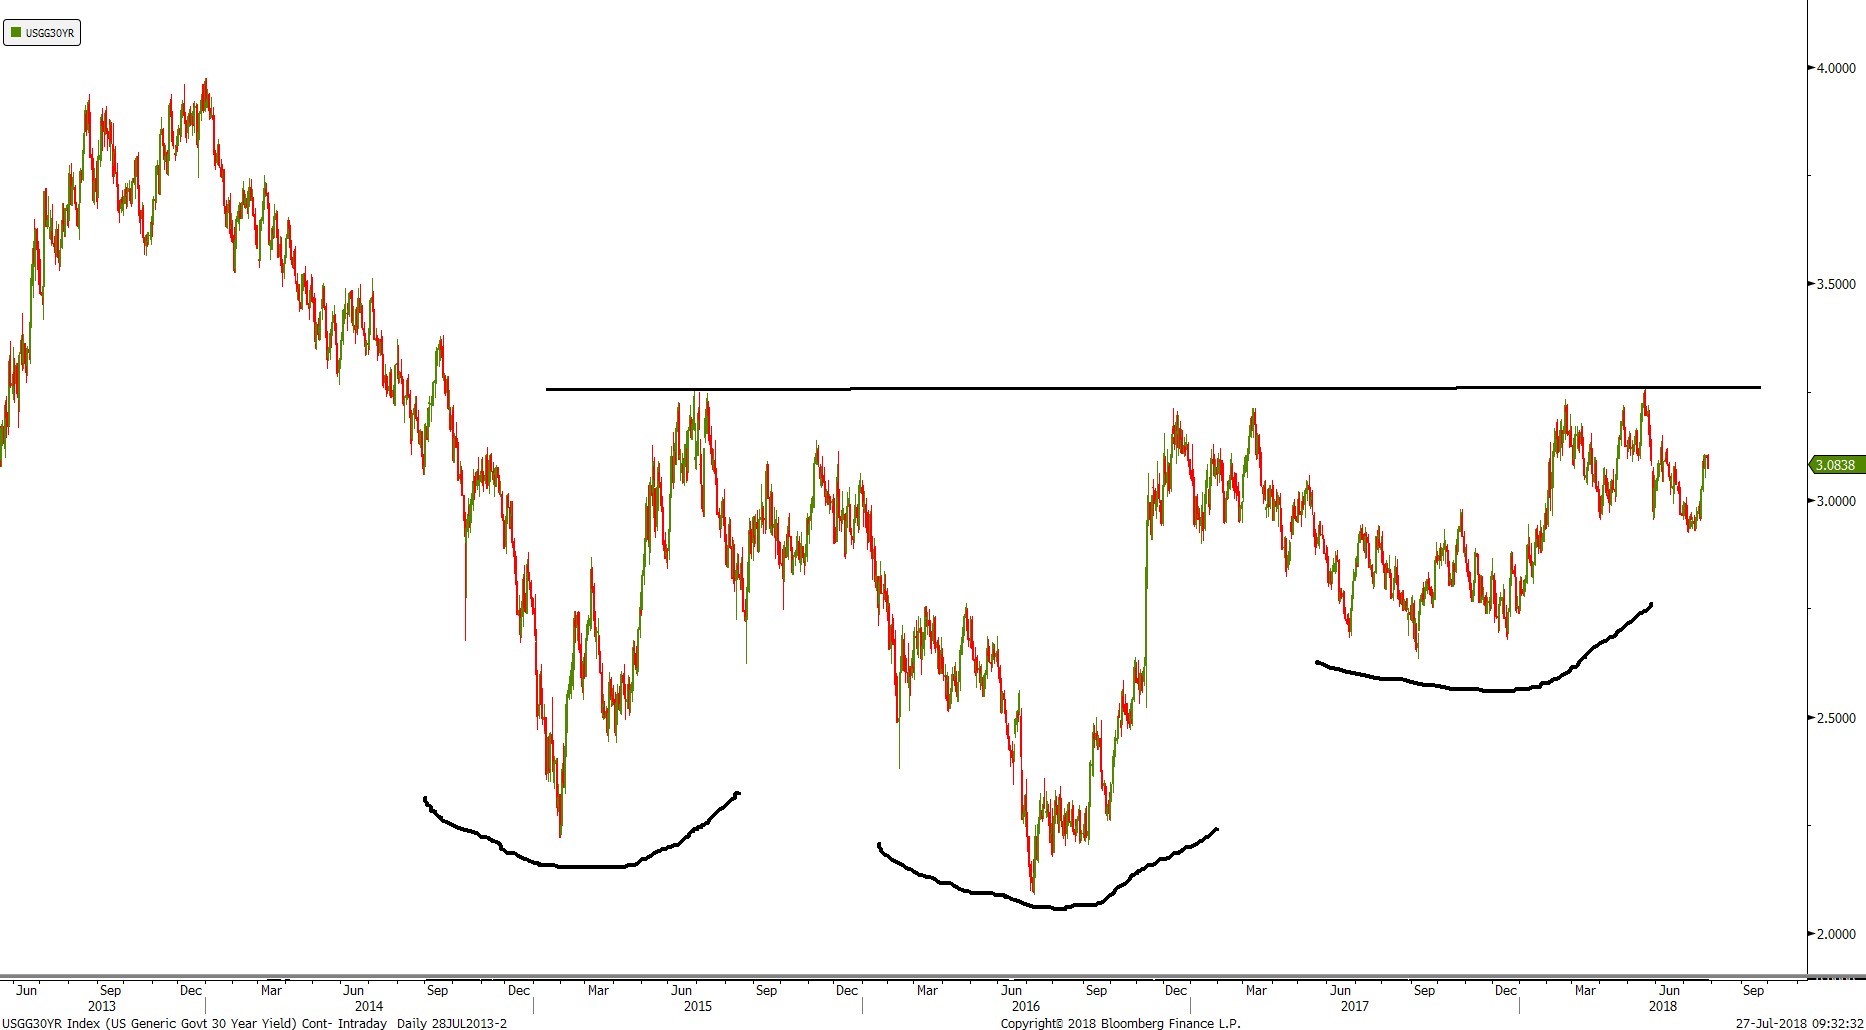
The weekly yield chart displays a massive H&S bottom pattern. Resistance in the 3.25% zone has repelled the advances. A 30-year Bond daily print of 3.32% would signal the start of a strong trend toward higher yields (lower futures prices).
Treasury Markets – Bond Yield Charts
