While watching Chairman Bernanke weave and bob in front of Congress this past week, I started to ponder what he said:
The U.S. economy has continued to recover, but economic activity appears to have decelerated somewhat during the first half of this year. After rising at an annual rate of 2-1/2 percent in the second half of 2011, real gross domestic product (GDP) increased at a 2 percent pace in the first quarter of 2012, and available indicators point to a still-smaller gain in the second quarter.
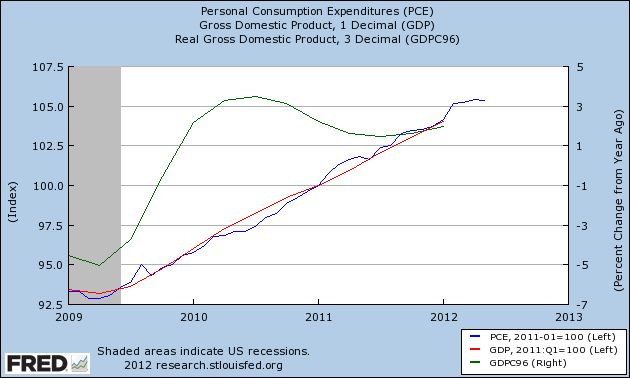
Really? You might think I am being sarcastic based on the current wave of soft data, but take a look at Personal Consumption Expenditures (blue line, left axis in graph below).
PCE growth has tracked GDP growth (red line, left axis on above graph) since the end of the Great Recession. Although PCE has slowed, it has remained in the range where the GDP growth could be 2.5%.
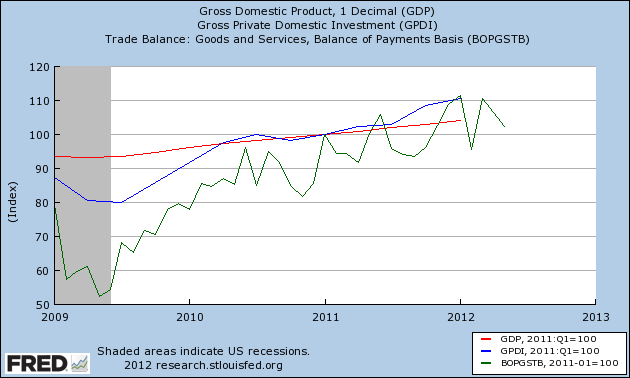
A gentle reminder that GDP (red line in below graph) is such a fickle number as it has elements in it – export / import (green line) or investments (blue line) that causes it to wobble. The graph below is indexed on January 2011.
Although I believe Chairman Bernanke is correct in theory that 2Q2012 GDP ran in the 2% range, don’t get excited if 2Q2012 GDP is anywhere between 1.5% and 2.5%. 1.5% likely would not be indicating a slowing economy, nor would 2.5% indicate further economic expansion. The consumer is not the primary problem in the weak GDP numbers.
Could the weak GDP numbers be caused by the artificially low interest rates?
Economic growth is also being supported by the exceptionally low level of the target range for the federal funds rate of 0 to 1/4 percent and the Committee’s forward guidance regarding the anticipated path of the funds rate. As I reported in my February testimony, the FOMC extended its forward guidance at its January meeting, noting that it expects that economic conditions–including low rates of resource utilization and a subdued outlook for inflation over the medium run–are likely to warrant exceptionally low levels for the federal funds rate at least through late 2014.
I continue to believe not allowing the market to set interest rates for long periods of time sets economic dynamics loose that there is little understanding. Low interest rates paid to consumers on deposits (literally zero) is in reality a new tax that consumers pay. This shifts potential consumer income to government to offset its debt payments. Could this invisible tax be part of the problem?
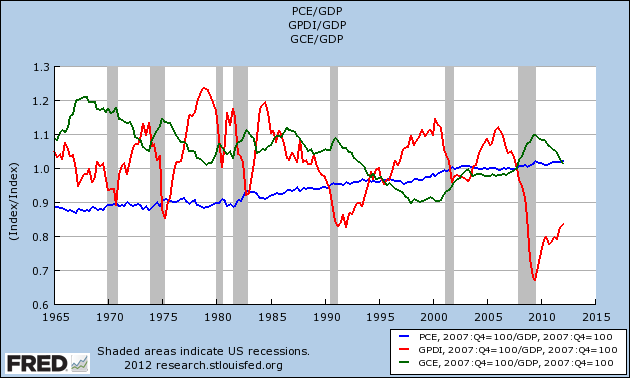
A look at GDP relationships shows that investment (red line on the above graph) is at post Great Depression lows. This graph indexed on the start date of the 2007 recession compares consumer expenditures (blue line), government expenditures (green line), and investment relationship to GDP (the 1.0 line on the above graphic).
Of course low interest rates do effect the decision to borrow for a capital investment – IF THAT INVESTMENT IS NEEDED. For business, the decision is based on return on investment. For consumer it is necessity, and/or enough slack in the budget to afford it. Most investment today is occurring as necessity – to reduce costs or improve balance sheets.
And finally the proverbial cliff:
….if the full range of tax increases and spending cuts were allowed to take effect–a scenario widely referred to as the fiscal cliff–a shallow recession would occur early next year and about 1-1/4 million fewer jobs would be created in 2013.
Chairman Bernanke issued a veiled warning – something had to be done with spending cuts and tax increases which will automatically kick in at the end of 2012. Like withdrawal from drugs, the Chairman was warning that the fiscal house needs to be put in order slowly.
Any economic shock is dangerous to a healthy economy. Then consider what damage could a shock do to the current crappy economy? John Lounsbury mused:
…. There is a way that what could become a reality can be turned into just a bad dream. The country and Congress could awaken to a different world than what still exists only as a nightmare, not yet actual reality. All Congress has to do is to agree to pass legislation that changes some or all of the otherwise automatic events. But that requires what has become an oxymoron: Congress agreeing to pass legislation.
So there is a possibility that Congress will not take action and the economy will “fall off” the fiscal cliff. It will not be completely like a long sleep (with the nightmare) becoming a coma (with a nightmare reality)
There is too much to ponder.
Other Economic News this Week:
The Econintersect economic forecast for July 2012 shows continues to show moderate growth. Overall, trend lines seem to be stable even with the fireworks in Europe, and emotionally cannot help thinking this is the calm before the storm. There are no recession flags showing in any of the indicators Econintersect follows which have been shown to be economically intuitive. There is no whiff of recession in the hard data – even though certain surveys are at recession levels.
ECRI stated in September 2011 a recession was coming, and now says a recession is already underway. The size and depth is unknown. A positive result is this pronouncement has caused much debate in economic cyberspace.
The ECRI WLI index value remains in negative territory – but this week is again “less bad”. The index is indicating the economy six months from today will be slightly worse than it is today. As shown on the graph below, this is not the first time since the end of the Great Recession that the WLI has been in negative territory, however the improvement from the troughs has been growing less good.
Current ECRI WLI Index
Initial unemployment claims increased from 350,000 (reported last week) to 386,000 this week. Last week’s decline appears to have been an anomaly as some pundits suggested. Historically, claims exceeding 400,000 per week usually occur when employment gains are less than the workforce growth, resulting in an increasing unemployment rate (background here and here). The real gauge – the 4 week moving average – declined from 376,500 (reported last week) to 375,500. Because of the noise (week-to-week movements from abnormal events AND the backward revisions to previous weeks releases), the 4-week average remains the reliable gauge.
Weekly Initial Unemployment Claims – 4 Week Average – Seasonally Adjusted – 2010 (blue line), 2011 (red line), 2012 (green line) 
Data released this week which contained economically intuitive components(forward looking) were
- Rail movements (where the economic intuitive components continue to be indicating a moderately expanding economy);
- Retail Sales (less good but still strong and away from recession levels);
- Manufacturing portion of Industrial Production (continuing to improve and well away from historical levels associated with recessions);
- Leading Economic Indicator (weakening, showing less good growth coming).
Weekly Economic Release Scorecard:
Click here to view the scorecard table below with active hyperlinks.

Bankruptcy this Week: FiberTower
