Classic Volume Price Analysis Lessons On The ES Emini Daily Chart

Published 03/02/2020, 07:25 AM
Updated 07/09/2023, 06:31 AM
ES Daily Chart

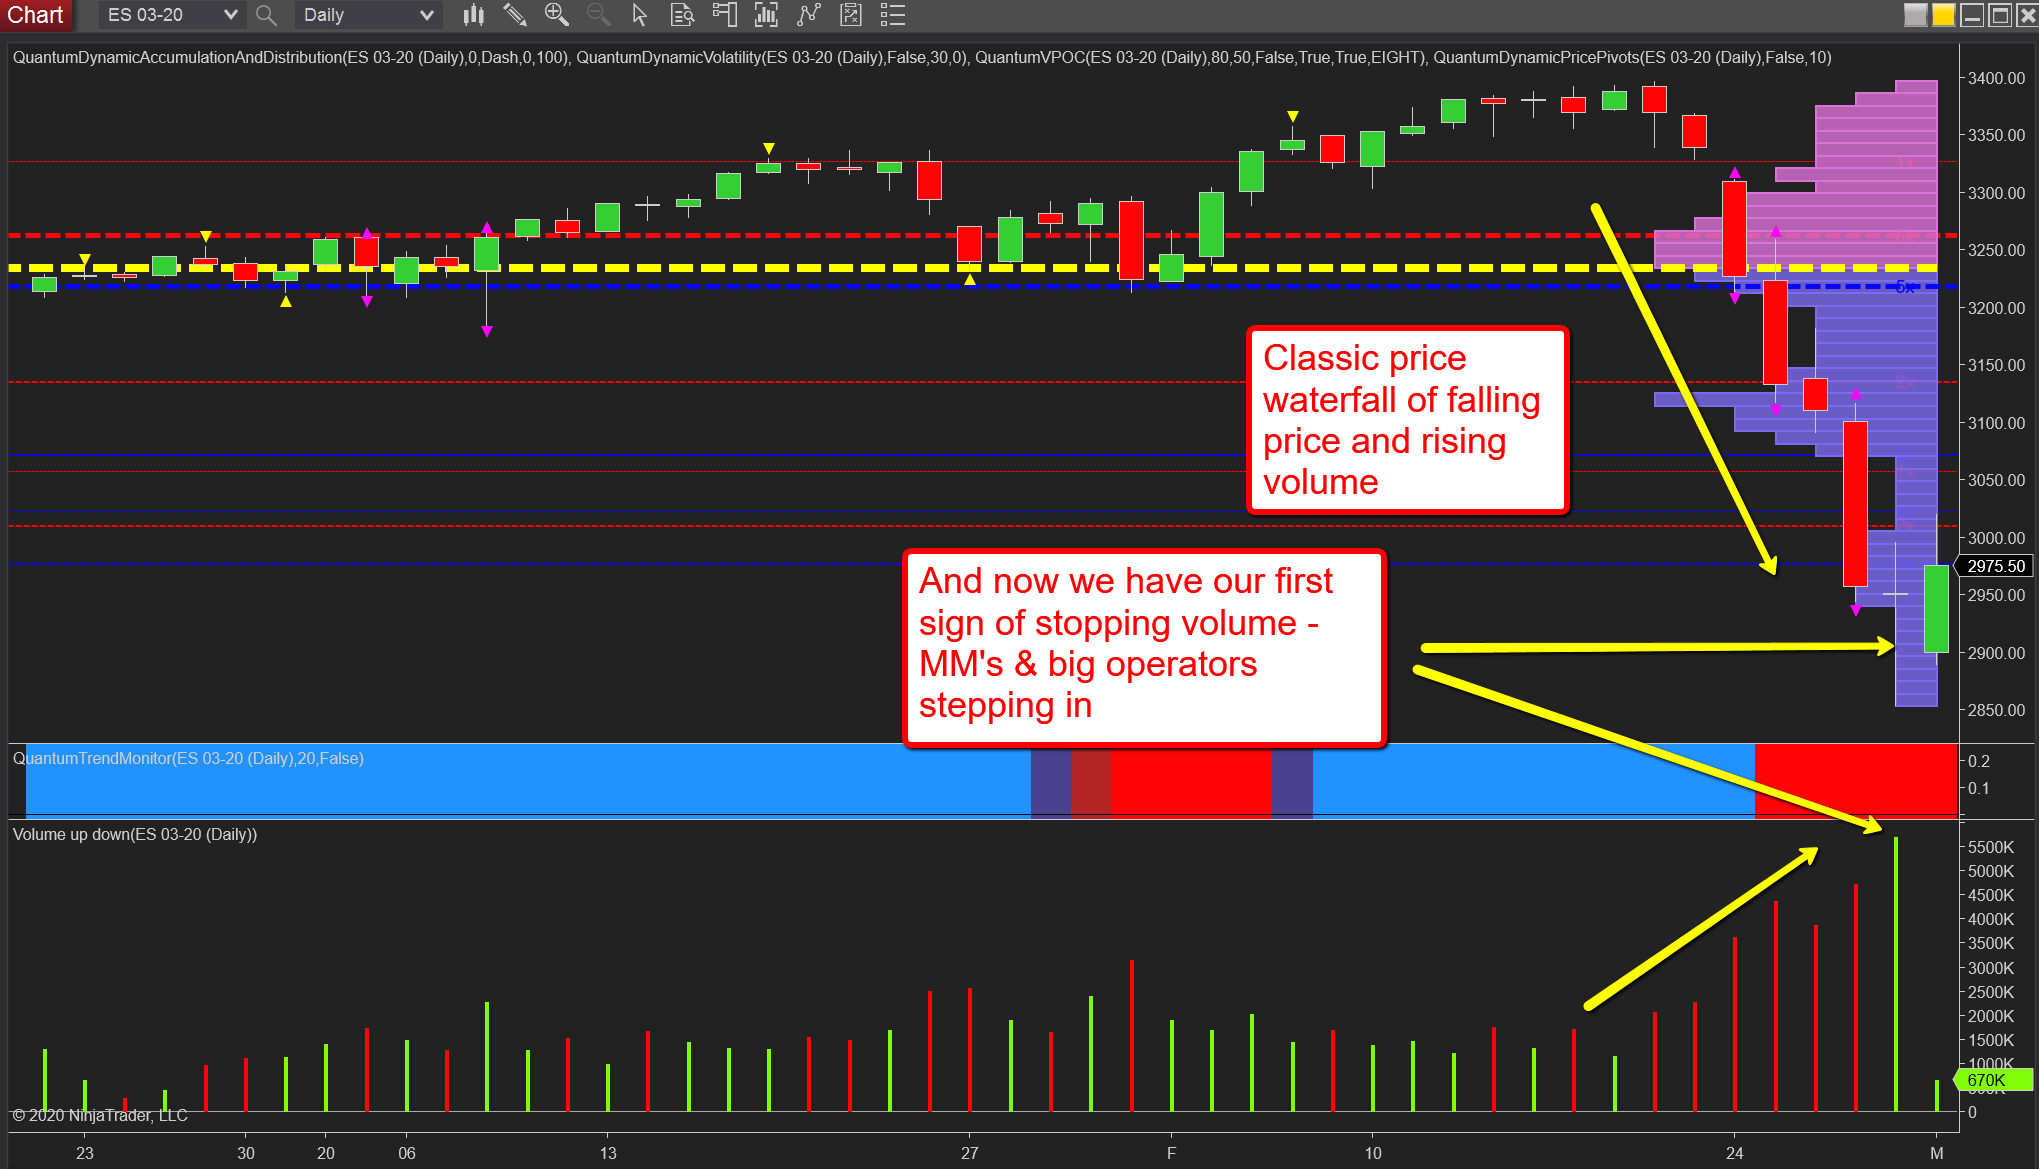
The daily chart for the ES Emini offers classic lessons in volume price analysis 101, a lesson which is also being played out on the NQ and the YM Emini futures in the same way.

If we start with last week’s price action driven by panic, the price waterfall which duly developed was classic with rising volume as the market collapsed with volume confirming price and vice versa.

Then on Friday, what do we see, another day of panic selling but one which was overwhelmed with buying as sentiment reversed late in the day on comments from the Federal Reserve, with the index closing with a deep wick to the lower body and back near the open, but on extreme volume. The highest of the week.

This is stopping volume, but after such a dramatic plunge, unlikely the market can absorb all of the selling in one effort, and over a relatively short period of a few hours. But, this is the first signal, the market makers are now stepping in to calm the markets and buy heavily now this profitable campaign is reaching its conclusion.

Now what we expect to see is further absorption of the selling pressure in a congestion phase, followed by a successful low volume test, before the recovery begins in earnest.

Latest comments

Loading next article…
Risk Disclosure: Trading in financial instruments and/or cryptocurrencies involves high risks including the risk of losing some, or all, of your investment amount, and may not be suitable for all investors. Prices of cryptocurrencies are extremely volatile and may be affected by external factors such as financial, regulatory or political events. Trading on margin increases the financial risks.
Before deciding to trade in financial instrument or cryptocurrencies you should be fully informed of the risks and costs associated with trading the financial markets, carefully consider your investment objectives, level of experience, and risk appetite, and seek professional advice where needed.
Fusion Media would like to remind you that the data contained in this website is not necessarily real-time nor accurate. The data and prices on the website are not necessarily provided by any market or exchange, but may be provided by market makers, and so prices may not be accurate and may differ from the actual price at any given market, meaning prices are indicative and not appropriate for trading purposes. Fusion Media and any provider of the data contained in this website will not accept liability for any loss or damage as a result of your trading, or your reliance on the information contained within this website.
It is prohibited to use, store, reproduce, display, modify, transmit or distribute the data contained in this website without the explicit prior written permission of Fusion Media and/or the data provider. All intellectual property rights are reserved by the providers and/or the exchange providing the data contained in this website.
Fusion Media may be compensated by the advertisers that appear on the website, based on your interaction with the advertisements or advertisers.
© 2007-2025 - Fusion Media Limited. All Rights Reserved.