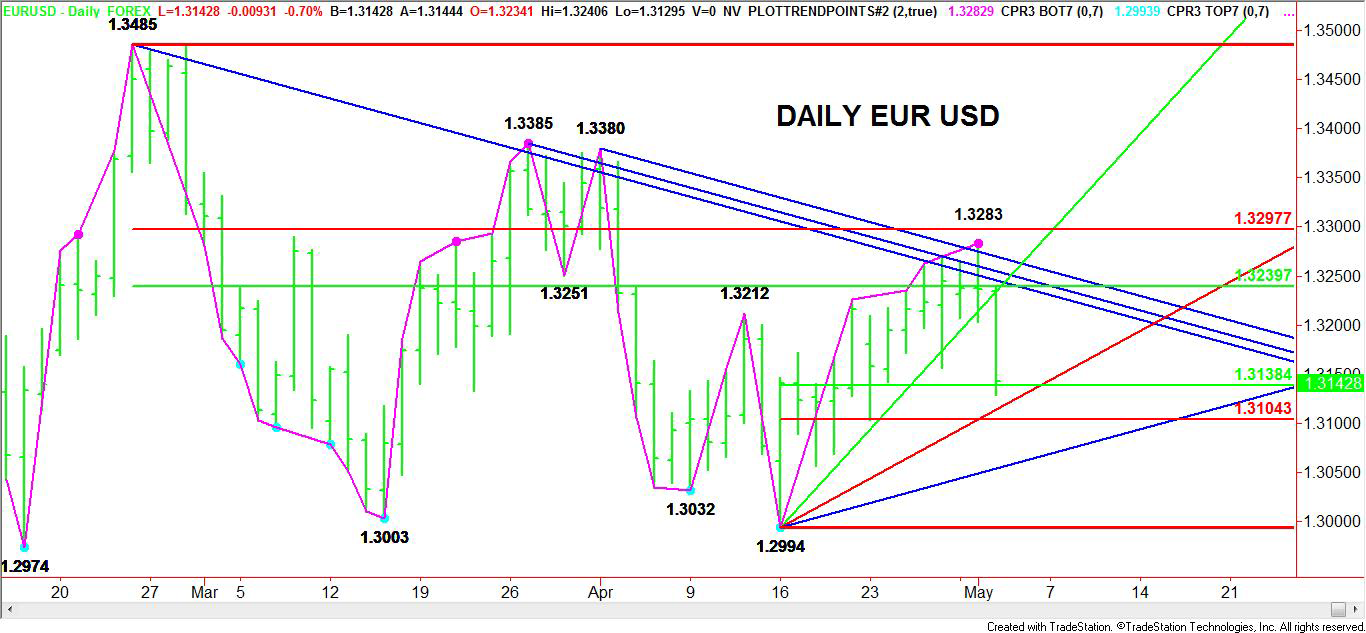
The EUR USD reached the apex of a triangle formation and plunged to the downside. The triangle chart pattern is a non-trending pattern and often indicates impending volatility especially as it nears the apex of the pattern. This pattern didn’t disappoint as bids were pulled under support and the market broke sharply.
Solid downtrending Gann angle resistance handled every attempt to breakout to the upside this week, causing bullish traders to give up, exposing the market to heavy selling pressure. Once the last breakout attempt failed on Tuesday and the market made a closing price reversal top, all that was left to hold the Euro was an uptrending Gann angle at 1.3234.
Once the bids were pulled and the sellers took control, the daily chart pattern indicated that there was nothing to stop the break until it reached a retracement zone or another uptrending Gann angle. Based on the short-term range of 1.2994 to 1.3283, a retracement zone was created at 1.3138 to 1.3104. The upper target or 50% level was tested this morning, producing a technical bounce, but nothing to indicate major buying was taking place. In fact, it appeared to be more of a profit-taking bounce rather than fresh buying.
Further downside pressure today could trigger a test of the uptrending Gann angle at 1.3114 or the Fibonacci price level at 1.31043. Since the main trend is up on the daily chart, a bottom could form in this area, but it would be better if a support base formed first since the height of the rally is often equal to the length of the base. A spike bottom tends to be met with renewed selling pressure after a short retracement to the upside.
If you missed the move, be patient for the next one to develop. Watch the trading action inside of the retracement zone for a large bid to appear. If big money likes this zone then they will provide the support for the next rally.
- English (UK)
- English (India)
- English (Canada)
- English (Australia)
- English (South Africa)
- English (Philippines)
- English (Nigeria)
- Deutsch
- Español (España)
- Español (México)
- Français
- Italiano
- Nederlands
- Português (Portugal)
- Polski
- Português (Brasil)
- Русский
- Türkçe
- العربية
- Ελληνικά
- Svenska
- Suomi
- עברית
- 日本語
- 한국어
- 简体中文
- 繁體中文
- Bahasa Indonesia
- Bahasa Melayu
- ไทย
- Tiếng Việt
- हिंदी
Classic Chart Pattern Fuels Euro Plunge
Published 05/02/2012, 09:00 AM
Classic Chart Pattern Fuels Euro Plunge
Latest comments
Loading next article…
Install Our App
Risk Disclosure: Trading in financial instruments and/or cryptocurrencies involves high risks including the risk of losing some, or all, of your investment amount, and may not be suitable for all investors. Prices of cryptocurrencies are extremely volatile and may be affected by external factors such as financial, regulatory or political events. Trading on margin increases the financial risks.
Before deciding to trade in financial instrument or cryptocurrencies you should be fully informed of the risks and costs associated with trading the financial markets, carefully consider your investment objectives, level of experience, and risk appetite, and seek professional advice where needed.
Fusion Media would like to remind you that the data contained in this website is not necessarily real-time nor accurate. The data and prices on the website are not necessarily provided by any market or exchange, but may be provided by market makers, and so prices may not be accurate and may differ from the actual price at any given market, meaning prices are indicative and not appropriate for trading purposes. Fusion Media and any provider of the data contained in this website will not accept liability for any loss or damage as a result of your trading, or your reliance on the information contained within this website.
It is prohibited to use, store, reproduce, display, modify, transmit or distribute the data contained in this website without the explicit prior written permission of Fusion Media and/or the data provider. All intellectual property rights are reserved by the providers and/or the exchange providing the data contained in this website.
Fusion Media may be compensated by the advertisers that appear on the website, based on your interaction with the advertisements or advertisers.
© 2007-2025 - Fusion Media Limited. All Rights Reserved.
