
Citigroup (NYSE:C) kick-started the earnings season and delivered a positive earnings surprise of 3.9% in fourth-quarter 2018, backed by expense control and lower cost of credit. Adjusted net income per share of $1.61 for the quarter handily outpaced the Zacks Consensus Estimate of $1.55. Also, adjusted earnings climbed 26% year over year.
Adjusted net income was $4.2 billion, up 14% year over year. Including the impact of tax reform, net income came in at $4.3 billion or $1.64 per share.
Citigroup displayed prudent expense management during the quarter. Moreover, higher equity market revenues, along with loan growth, were positives. However, investment banking revenues disappointed as strong advisory business were more than offset by lower underwriting fees on lower market activity.
Additionally, as expected, lower fixed income market revenues amid challenging trading environment and expanding credit spreads, mainly in December, was on the downside.
Citigroup’s costs of credit for the Dec-end quarter were down 7% year over year to $1.93 billion. This fall largely underlines reduced net credit losses of $1.8 billion and a credit reserve build of $111 million.
For full-year 2018, adjusted net income came in at $18 billion compared with $15.8 billion recorded in 2017.
Expenses Drop, Revenues Disappoint
For full-year 2018, the company reported revenues of $72.9 billion, up 1% year over year. Yet it lagged the Zacks Consensus Estimate of $73.3 billion.
Revenues were down 2% year over year to $17.1 billion in the reported quarter. The reported figure also missed the Zacks Consensus Estimate of $17.5 billion. Reduced revenues from Institutional Clients Group (ICG) and the wind-down of legacy assets in Corporate/Other segment were responsible for the downside.
In ICG, revenues came in at $8.2 billion in the quarter, down 1% year over year. Fixed income market revenues decreased 21% year over year, leading lower total markets and securities services revenues by 11%. However, equity markets were up 18% and total banking revenues rose 5%, partly offset by lower investment banking revenues.
Global Consumer Banking (GCB) revenues declined slightly year over year to $8.4 billion. Higher revenues in North and Latin America were offset by lower revenues in Asia GCB.
Corporate/Other revenues came in at $470 million, slipping 37% from the prior-year quarter. The decline mainly underscores legacy assets runoff.
Operating expenses at Citigroup dipped 4% year over year to $9.9 billion. Higher compensation costs, efficiency savings and the winding-down of legacy assets muted the elevated volume-related expenses and ongoing investments.
Strong Balance Sheet
At the end of the quarter, Citigroup’s end of period assets was $1.92 trillion, slightly down sequentially. The company’s loans grew 1% sequentially to $684 billion. Deposits increased 1% sequentially to $1.01 trillion.
Credit Quality Improves
Total non-accrual assets decreased 24% year over year to $3.6 billion. The company reported a dip of 17% in consumer non-accrual loans to $2.2 billion. In addition, corporate non-accrual loans of $1.3 billion plunged 32% from the year-earlier period.
Citigroup’s total allowance for loan losses was $12.3 billion at the end of the quarter, or 1.81% of total loans, compared with $12.4 billion, or 1.86%, recorded in the year-ago period.
Solid Capital Position
At the end of the Oct-Dec period, Citigroup’s Common Equity Tier 1 Capital ratio was 11.9%, down from 12.4% in the prior-year quarter. The company’s supplementary leverage ratio for the quarter came in at 6.4%, down from 6.7% in the year-earlier quarter.
As of Dec 31, 2018, book value per share was $75.05, up 6% year over year, and tangible book value per share was $63.79, up 6% from the comparable period last year.
Capital Deployment
During 2018, Citigroup repurchased about 212 million of common stock. The company returned around $18.4 billion to common shareholders as common stock repurchases and dividends.
Notably, during fourth-quarter 2018, the company bought back about 74 million of common stock and returned around $5.8 billion to common shareholders as common stock repurchases and dividends.
Our Viewpoint
Citigroup reported impressive results even this time around, though the bank was unfavorably impacted by lower investment banking revenues and challenging trading environment. The company exhibits capital strength which continues to support its dividend and share-buyback program. Furthermore, lower credit costs are commendable. In addition, decline in expenses reflect prudent expense management.
One can consider a strong brand like Citigroup to be a sound investment option over the long term, given its global footprint and attractive core business. Additionally, the company’s growth looks encouraging amid rising rate environment, as well as anticipated ease of regulations.
Nevertheless, several legal hassles remain concerns for the company.
Citigroup Inc. Price, Consensus and EPS Surprise
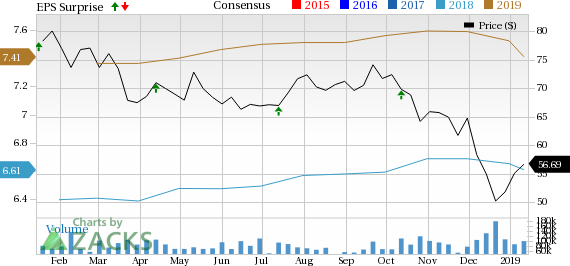
Citigroup Inc. Price, Consensus and EPS Surprise | Citigroup Inc. Quote
At present, Citigroup carries a Zacks Rank #3 (Hold). You can see the complete list of today’s Zacks #1 Rank (Strong Buy) stocks here.
Among other major banks, Wells Fargo (NYSE:WFC) and JPMorgan (NYSE:JPM) are slated to report fourth-quarter results on Jan 15, while Bank of America Corporation (NYSE:BAC) will release its quarterly numbers on Jan 16.
Today's Stocks from Zacks' Hottest Strategies
It's hard to believe, even for us at Zacks. But while the market gained +21.9% in 2017, our top stock-picking screens have returned +115.0%, +109.3%, +104.9%, +98.6%, and +67.1%.
And this outperformance has not just been a recent phenomenon. Over the years it has been remarkably consistent. From 2000 - 2017, the composite yearly average gain for these strategies has beaten the market more than 19X over. Maybe even more remarkable is the fact that we're willing to share their latest stocks with you without cost or obligation.
See Them Free>>
Original post
Zacks Investment Research
Which stock should you buy in your very next trade?
With valuations skyrocketing in 2024, many investors are uneasy putting more money into stocks. Unsure where to invest next? Get access to our proven portfolios and discover high-potential opportunities.
In 2024 alone, ProPicks AI identified 2 stocks that surged over 150%, 4 additional stocks that leaped over 30%, and 3 more that climbed over 25%. That's an impressive track record.
With portfolios tailored for Dow stocks, S&P stocks, Tech stocks, and Mid Cap stocks, you can explore various wealth-building strategies.