
Cinemark Holdings Inc. (NYSE:CNK) reported mixed financial results in the second quarter of 2017. The top line surpassed the Zacks Consensus Estimate while the bottom line was in line with the same.
Quarterly net income was $51.2 million or 44 cents per share compared with $53.9 million or 46 cents in the year-ago quarter. The company’s reported earnings figure of 44 cents per share was in line with the Zacks Consensus Estimate.
Quarterly total revenue of $751.2 million was up 0.9% year over year beating the Zacks Consensus Estimate of $747.1 million.
Segment-wise, Admissions revenues were $449.9 million, up 1.4% year over year. Concession revenues grossed $262.3 million, up 3.4%. Other revenues were $39 million, down 12.3% year over year. Geographically, U.S. revenues totaled $554.9 million, down 1% year over year. International revenues were $199.9 million, up 6.6%.
Quarterly operating costs and expenses totaled $653 million, up 2.2% year over year. Operating income was $98.2 million, down 7% year over year. Operating margin was 13.1% compared with 14.2% in the prior-year quarter. Adjusted EBITDA in the reported quarter was $170.7 million, up 1.4% from the year-ago quarter.
At the end of the first quarter of 2017, Cinemark had $504.2 million of cash and cash equivalents and $1,789.6 million of debt outstanding compared with $561.2 million and $1,789.2 million, respectively, at 2016 end. At the end of the reported quarter, the debt-to-capitalization ratio was 0.57 compared with 0.58 at the end of 2016.
Cinemark Holdings Inc Price, Consensus and EPS Surprise
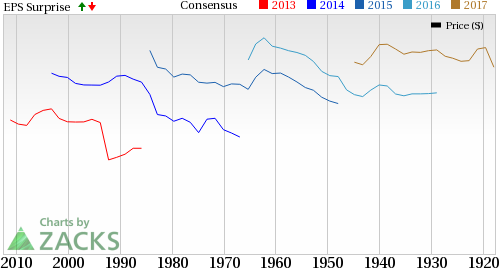
Cinemark Holdings Inc Price, Consensus and EPS Surprise | Cinemark Holdings Inc Quote
Operating Metrics
In the reported quarter, Cinemark’s worldwide average screen count was 5,904, up 0.7% year over year. Average ticket price was $6.48, up 3.7% year over year. Concession revenues per patron were $3.78, up 8.9% year over year. Worldwide attendance was 69.4 million, down 4.9% year over year.
Cinemark Holdings is a leading motion picture exhibition company. Its major competitors include AMC Entertainment Holdings Inc. (NYSE:AMC) , Six Flags Entertainment Corp. (NYSE:SIX) and IMAX Corp. (NYSE:IMAX) . All these stocks currently carry a Zacks Rank #3 (Hold) while Cinemark Holdings has a Zacks Rank #4 (Sell).
You can see the complete list of today’s Zacks #1 Rank (Strong Buy) stocks here.
Today's Stocks from Zacks' Hottest Strategies
It's hard to believe, even for us at Zacks. But while the market gained +18.8% from 2016 - Q1 2017, our top stock-picking screens have returned +157.0%, +128.0%, +97.8%, +94.7%, and +90.2% respectively.
And this outperformance has not just been a recent phenomenon. Over the years it has been remarkably consistent. From 2000 - Q1 2017, the composite yearly average gain for these strategies has beaten the market more than 11X over. Maybe even more remarkable is the fact that we're willing to share their latest stocks with you without cost or obligation. See Them Free>>
Six Flags Entertainment Corporation New (SIX): Free Stock Analysis Report
Cinemark Holdings Inc (CNK): Free Stock Analysis Report
AMC Entertainment Holdings, Inc. (AMC): Free Stock Analysis Report
Imax Corporation (IMAX): Free Stock Analysis Report
Original post
Zacks Investment Research