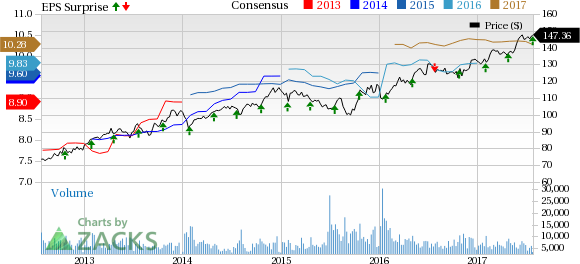
Chubb Limited (NYSE:CB) reported second-quarter 2017 operating income of $2.50 per share, which surpassed the Zacks Consensus Estimate of $2.49 by 0.4%. Further, the bottom line improved 11% from $2.25 per share in the prior-year quarter.
Including one-time integration and merger-related expenses of 10 cents, amortization of fair value adjustment of acquired invested assets of 11 cents and long-term debt and net realized loss of 48 cents, net income skyrocketed about 80% year over year to $2.77 per share.
Quarter in Details
Net premiums written declined nearly 0.8% year over year to about $7.5 million in the reported quarter. Net premiums earned decreased 2.3% to $7.2 million. Premiums were adversely affected due to purchase of reinsurance and merger related underwriting actions.
Net investment income was $770 million, up 9% from a year ago.
Property and casualty (P&C) underwriting income totaled $808 million, surging 33% year over year. The upside can be attributed to expense efficiencies from the merger and impressive combined ratios. Combined ratio improved 320 basis points (bps) to 88%.
Segment Update
North America Commercial P&C Insurance: Net premiums written declined 1.3% year over year to $3.2 million. Combined ratio improved 360 bps to 85.2%.
North America Personal P&C Insurance: Net premiums written increased 2% year over year to $1.2 million. Combined ratio improved 50 bps to 89.6%.
Overseas General Insurance: Net premiums written declined 1.2% year over year to $2.0 million. Combined ratio deteriorated 360 bps to 87.3%.
North America Agricultural Insurance: Net premiums written increased 7.5% year over year to $403 million. Combined ratio improved 260 bps to 93.3%.
Global Reinsurance: Net premiums written dropped nearly 17.4% year over year to $190 million. Combined ratio improved by 1960 bps to 60.2%.
Life Insurance: Net premiums written decreased 0.76% year over year to $523 million.
Financial Update
Cash balance was $1.3 million as of Jun 30 2017, up approximately 32% from the end of 2016. Total shareholders' equity grew about 4.3% from $48.3 million at year-end 2016.
Book value per share was $108.19 as of Jun 30, 2017, 4% from year-end 2016.
Operating cash flow was $627 million in the quarter.
Share Repurchase Update
Chubb spent $335 million to buy back 2.4 million shares in the quarter.
Update on Integration-Related Realized and Annualized Run-Rate Savings
Chubb now expects to achieve annualized run-rate savings of $875 million by the end of 2018. This is increased from $800 million guided earlier. Integration and merger-related expenses are projected at $903 million, up from $809 million.
Zacks Rank
Chubb currently carries a Zacks Rank #4 (Sell). You can see the complete list of today’s Zacks #1 Rank (Strong Buy) stocks here
Performance of Other Insurers
Among other players from the insurance industry that have reported their second-quarter earnings so far, the bottom line at Brown & Brown, Inc. (NYSE:BRO) and Fidelity National Financial, Inc. (NYSE:FNF) beat their respective Zacks Consensus Estimates, while The Progressive Corporation (NYSE:PGR) missed the same.
The Hottest Tech Mega-Trend of All
Last year, it generated $8 billion in global revenues. By 2020, it's predicted to blast through the roof to $47 billion. Famed investor Mark Cuban says it will produce "the world's first trillionaires," but that should still leave plenty of money for regular investors who make the right trades early. See Zacks' 3 Best Stocks to Play This Trend >>
D/B/A Chubb Limited New (CB): Free Stock Analysis Report
Fidelity National Financial, Inc. (FNF): Free Stock Analysis Report
Brown & Brown, Inc. (BRO): Free Stock Analysis Report
Progressive Corporation (The) (PGR): Free Stock Analysis Report
Original post
Zacks Investment Research

