'Tis the Season for the most powerful seasonality trade of the year!
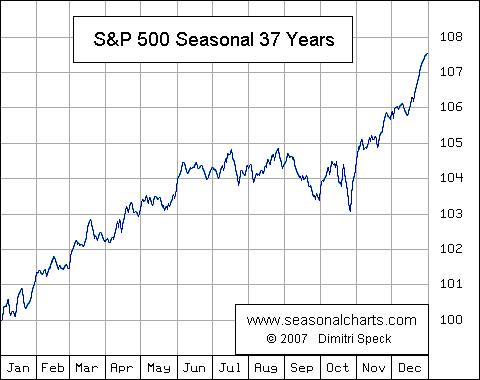
With the stock market up big in 2013, most participants are speculating on a pullback in the next week or two. I have to say I am on the other side of that bet. Being a technical trader I focus on patterns, statistics and probabilities to power my ETF trading strategies. So with 37 years of stats the seasonality chart of the S&P 500 index paints a clear picture of what is likely to happen in December.
If you do not know how to read a seasonality chart, I will explain as its very simple. The chart simply shows what the index has done on average through each month over the past 37 years. December typically has the strongest up trend as well as the strongest probability of that happening over any other time of the year.
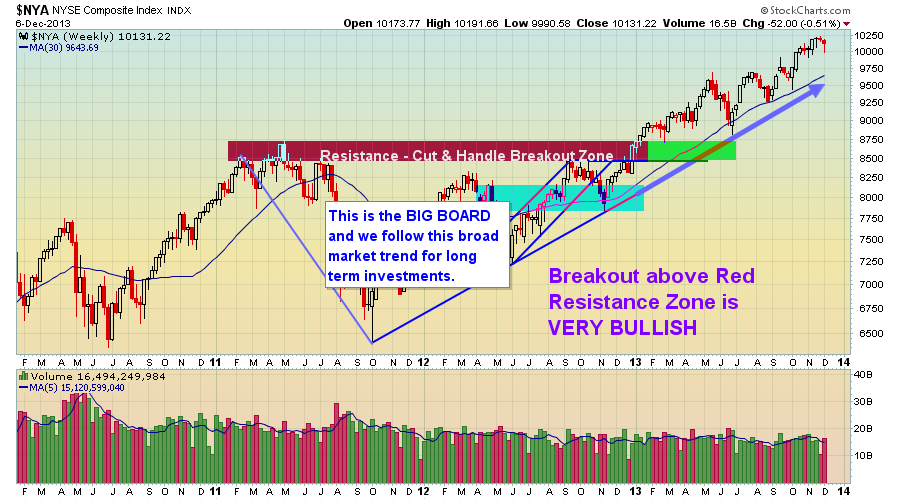
The Big Board – NYSE
The NYSE also referred to as the Big Board, is an index with the largest brand name companies. Most individuals do not follow this, but to me it's as close to the holy grail of trading as anything else I know. I use many different data points from this index (momentum, order flow, trend) for my ETF trading strategies.
You must follow the trend of this index if you want to be on the right side of the market. While I follow and track the New York Stock Exchange closely (it even has its own fund the iShares NYSE Composite Fund (NYC) but it’s an ETF I do not use). These big stocks are what really move the market (S&P 500) I believe, so I always trade with this index trend in mind. 
S&P 500 Weekly ETF Trading Strategy – Bullish
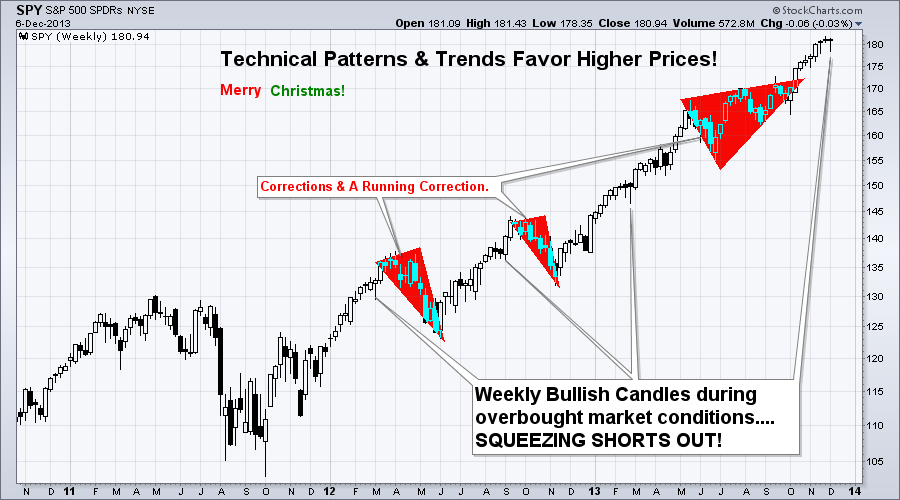
The chart below is self-explanatory I think… But let me recap.
The overall trend is up, so your ETF trades should be to the long side buying on the dips. The chart below goes back three years so the candles are a little condensed and small, but what you need to know are these two points:
1. After a correction within a trend, probability says that price is more likely to continue rising than it is to reverse. Notice the market just had a running correction through the summer months.
2. A reversal candle on the weekly chart (bullish reversal candle) generally indicates a 2-3 week rally is likely to happen.
Conclusion: Seasonality says higher prices, weekly chart below shows bullish reversal candle…Oya!
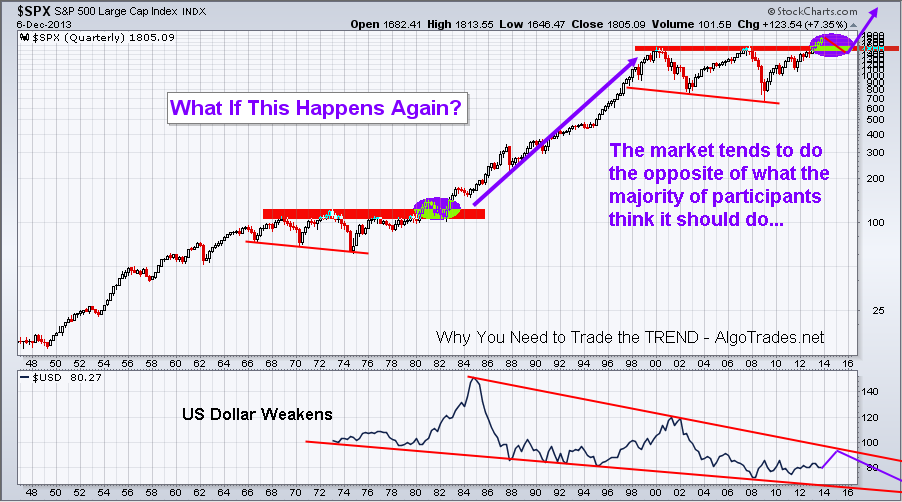
The Bigger Picture: 3 -6 Months Out…
This is a quarterly chart and BIG picture outlook. Over the next 3-6 months we could see the stock market start to become choppy and rollover into a minor bear market for a couple years. That is the best case scenario I think. The other scenario is a major crash back down to the 700-1000 level on the S&P 500 which would cripple the baby boomers, delay their retirement, and getting a job would be impossible for almost everyone – full blown recession way worse than what everyone is saying we are in now.
Things are going to be really interesting over the next few years; You better be prepared to make a killing during the next bear market or life will not be fun. 
ETF Trading Strategies Holiday Conclusion:
In short, I think we have a couple good weeks ahead of us. Holiday season, quality family time and a rising stock market all paint a nice picture in my mind.
I hope this report was helpful and somewhat educational. I always appreciate feedback and things you would like me to write about how I interpret, trade or analyze things. I am here to help and new topics to write about are always welcome!
- English (UK)
- English (India)
- English (Canada)
- English (Australia)
- English (South Africa)
- English (Philippines)
- English (Nigeria)
- Deutsch
- Español (España)
- Español (México)
- Français
- Italiano
- Nederlands
- Português (Portugal)
- Polski
- Português (Brasil)
- Русский
- Türkçe
- العربية
- Ελληνικά
- Svenska
- Suomi
- עברית
- 日本語
- 한국어
- 简体中文
- 繁體中文
- Bahasa Indonesia
- Bahasa Melayu
- ไทย
- Tiếng Việt
- हिंदी
Christmas Rally Starts Monday. Some Strategies To Benefit
Published 12/08/2013, 12:14 AM
Updated 07/09/2023, 06:31 AM
Christmas Rally Starts Monday. Some Strategies To Benefit
Latest comments
Loading next article…
Install Our App
Risk Disclosure: Trading in financial instruments and/or cryptocurrencies involves high risks including the risk of losing some, or all, of your investment amount, and may not be suitable for all investors. Prices of cryptocurrencies are extremely volatile and may be affected by external factors such as financial, regulatory or political events. Trading on margin increases the financial risks.
Before deciding to trade in financial instrument or cryptocurrencies you should be fully informed of the risks and costs associated with trading the financial markets, carefully consider your investment objectives, level of experience, and risk appetite, and seek professional advice where needed.
Fusion Media would like to remind you that the data contained in this website is not necessarily real-time nor accurate. The data and prices on the website are not necessarily provided by any market or exchange, but may be provided by market makers, and so prices may not be accurate and may differ from the actual price at any given market, meaning prices are indicative and not appropriate for trading purposes. Fusion Media and any provider of the data contained in this website will not accept liability for any loss or damage as a result of your trading, or your reliance on the information contained within this website.
It is prohibited to use, store, reproduce, display, modify, transmit or distribute the data contained in this website without the explicit prior written permission of Fusion Media and/or the data provider. All intellectual property rights are reserved by the providers and/or the exchange providing the data contained in this website.
Fusion Media may be compensated by the advertisers that appear on the website, based on your interaction with the advertisements or advertisers.
© 2007-2025 - Fusion Media Limited. All Rights Reserved.
