Gold and silver, the shiny magical metals that adorn our culture. Each has a place in jewelry and each a place in the economy. For the last two years the price of gold has been falling - in fact, it has been a pretty steady decline in a channel. And silver has moved lower right along with it.
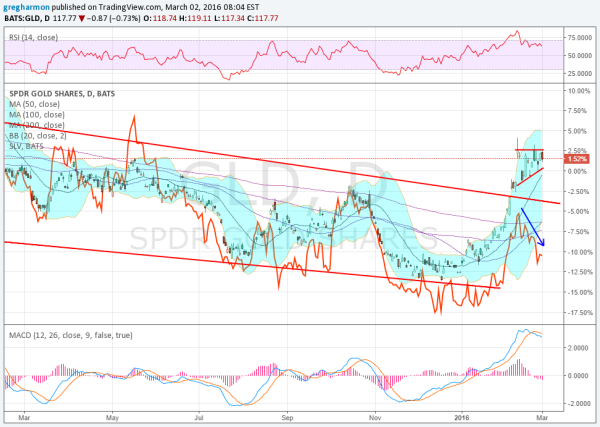
The chart below shows how the price of gold has traveled over the last year. It also shows how silver has stayed right with it. There was a 2-week period in May when silver outperformed, but that quickly adjusted.
There is a lot to say about gold in this chart, but what may be more interesting right now is the divergence in silver again. Markets suggest that traders are choosing gold over silver.

With gold breaking out of the downward channel, silver is actually turning lower. As gold is making a new 52-week high, silver did not even get back over the October high. Recognizing how long this divergence will remain and which way it will correct could make many traders rich.
The gold chart shows some signs of being overbought. The RSI is pulling back from an overbought condition and the MACD crossed down at an extreme level. But the SMAs and Bollinger Bands® continue to point higher. A divergence in the gold indicators suggests that a pullback in gold may find support quickly.
One way to trade this is to be long on silver and short on gold. With this pairing it does not matter if the gold/silver divergence resolves with silver rising or gold correcting. Either way, the convergence is a winner.
Disclaimer: The information in this blog post represents my own opinions and does not contain a recommendation for any particular security or investment. I or my affiliates may hold positions or other interests in securities mentioned in the blog, please see my Disclaimer page for my full disclaimer.
