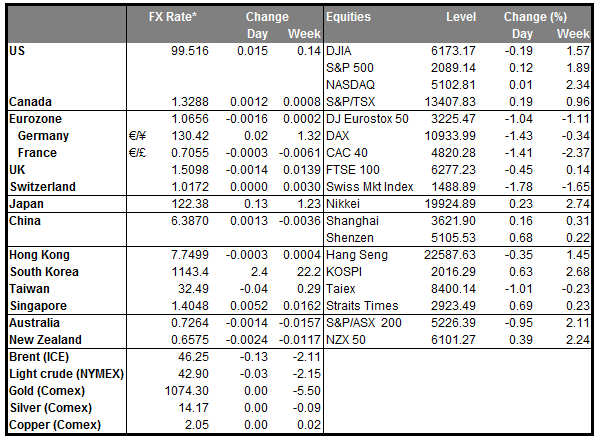
• China remains the epicenter of the markets China’s central bank set the daily midpoint rate for the yuan higher for a second day, in an attempt to ease fears that it is trying to weaken its currency to gain a competitive export advantage. Nevertheless, the Asian equity markets continue to tumble and the carnage seems to have no end. The recent yuan’s depreciation and the recent weak economic data added to the possibility of more bad news out of China and that it might be hard for the nation to achieve economic growth above 6.5%. Australia and New Zealand, whose economies are heavily dependent on exports to China, saw their currencies weakening further. Now the focus shifts on Chinese trade data to be released on Wednesday.
• The dollar pared gains as worries over China kept demand for safe-haven investments, despite a strong US employment report. Nonfarm payrolls increased 292k in December from an upwardly revised 252k previously, and above expectations of 200k. Even though the jobs report seems to be solid, the flat average weekly earnings point to weak inflationary pressures. The minutes of the Fed’s December meeting showed that the debate over the outlook for inflation will be crucial to determine the future path of rate increases. If the inflation data going forward do not improve, the Fed may hold off on rate increases. As a result, we will need strong data going forward to give the bulls a good reason to buy USD back.
• Elsewhere, the South African Rand collapsed at the opening on Monday, falling more than 10% against the dollar. The move was most likely flow driven, as the lack of liquidity outside the major pairs and position liquidation hurt ZAR, which has unwind most of the move. Even though today’s move was not based on fundamental reasons, the currency continue to make new record lows against the dollar as global markets trembled in response to the deepening turmoil in China and other major emerging markets. On top of that, South Africa’s President fired two finance ministers in four days raising frustration among businesses and investors with his leadership skills. Economists believe the country’s growth could decelerate for the 3rd consecutive year to less than 1% annually, as the soft demand for SA’s minerals continues to fall. USD/ZAR is likely to correct most of its extreme move today but the pair is poised to move higher.
• Today’s highlights: Norway’s CPI rate for December is expected to have slowed slightly to +2.7% yoy from 2.8% yoy previously, but to still remain above the Norges Bank target of 2.5%. The Bank has shown no significant concern regarding the level of the inflation as it is mainly attributed to the weak NOK. Therefore, market participants are most likely to watch the oil prices as a proxy for the krone’s near-term direction.
• From Canada, the housing starts for December are due to be released.
• As for the rest of the week, the spotlight will be on the Bank of England monetary policy meeting on Thursday. No change in policy is expected while consensus is that the vote will once again be split 8-1 with Ian McCafferty to maintain his call for a rate hike. The minutes of the meeting are released at the same time as the decision, which makes meeting days more interesting than before. This gives us the opportunity to get additional insights about members’ views on the UK economic outlook and future decisions, especially with the “Brexit” referendum looming and sterling testing its lowest levels since June 2010 vs USD. The minutes of the last meeting showed that the committee expected the CPI rate to have returned to positive territory and to continue rising as the effects of falling energy prices last year dropped out of the calculation. While inflation did marginally emerged above zero, oil prices fell even further since the BoE’s meeting and the country’s economic data have been mixed. That said, we will closely monitor the meeting for any hints on just how far market expectations for the first increase in the Bank rate have been pushed back.
• On Tuesday, we get the UK’s industrial production for November. Expectations are for the industrial output to have remained flat, a slowdown from October’s +0.1% mom rise. The construction and manufacturing PMIs for the same month were not particularly encouraging. As such, we see an increased likelihood for a soft industrial production figure, which could weaken GBP at the release.
• On Wednesday, China’s trade surplus is forecast to have narrowed somewhat in December, with imports once again expected to have fallen at a faster pace than exports. Both imports and exports are also expected to fall faster than the previous month, reflecting sluggish domestic demand in the world’s second largest economy. Since Australia and New Zealand are heavily reliant on exports to China, the rapid fall in Chinese imports in particular could put AUD and NZD under renewed selling pressure.
• On Thursday, besides the BoE meeting, Australia’s unemployment rate is expected to have ticked up a bit in December, after printing two consecutive months of solid employment gains. Net employment is expected to fall by 12.5k after rising 71.5k in November. Even though we would expect overall employment to have remained supported due to the holiday season demand, if the forecast is confirmed, it could weaken AUD a bit on the news.
• From Sweden, we get the CPI and CPIF for December. Both rates are forecast to have remained unchanged from the month before. In the minutes of its latest policy meeting, the Riksbank stated that there was an upward trend in inflation, but noted that the upturn is volatile and not yet on a firm footing. A possible positive surprise in the CPI rate could solidify the Bank’s view and support SEK a bit, at least temporarily.
• On Friday, the US retail sales for December are expected to have slowed from November. Nevertheless, due to the December holiday period and the low energy prices, we see a possibility for a higher-than-expected reading. This could encourage USD-bulls to add to their positions.
The Market
EUR/USD rebounds from 1.0800 again
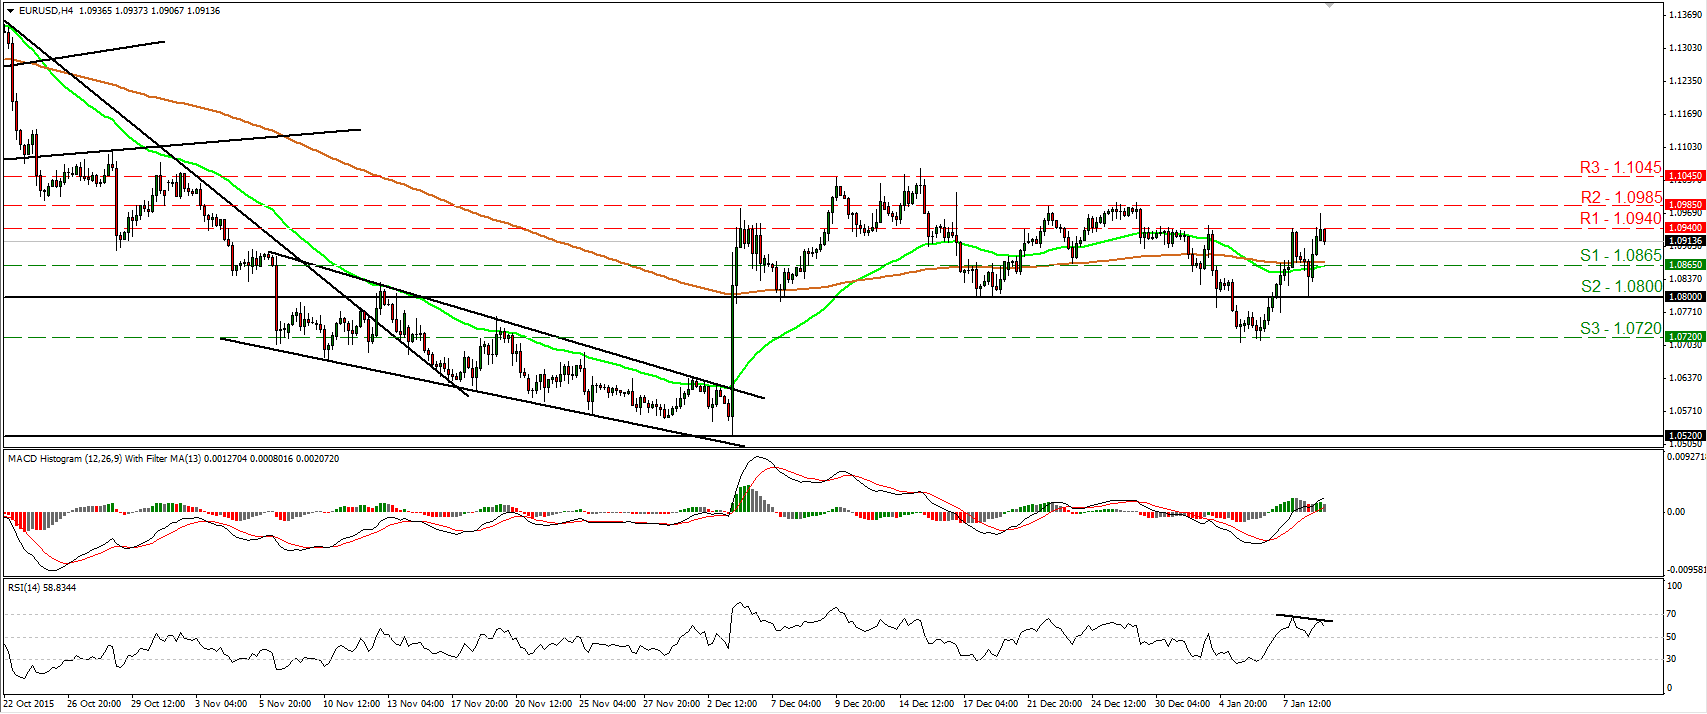
• EUR/USD traded lower on Friday following the better-than-expected NFP print for December. However, the rate found support once again at the 1.0800 (S2) line and rebounded to hit resistance slightly below the 1.0985 (R2) resistance hurdle. Taking into account the rebound from 1.0800 (S2), I prefer to adopt a “wait and see” stance for now with regards to the short-term outlook. I would like to see another dip below 1.0800 (S2) before turning my eyes back to the downside. Looking at our momentum studies, I see that the RSI turned down after it found resistance slightly below its 70 line, while the MACD, stands above both its zero and signal lines. These signs corroborate my view to stand pat for now. Switching to the daily chart, I see that the 1.0800 (S2) key hurdle is the lower bound of the range the pair had been trading from the last days of April until the 6th of November. I also see that on the 7th and 17th of December, the rate rebounded from that zone. Therefore, Friday’s rebound from that level makes me stay flat as far as the medium-term picture is concerned as well.
• Support: 1.0865 (S1), 1.0800 (S2), 1.0720 (S3)
• Resistance: 1.0940 (R1), 1.0985 (R2), 1.1045 (R3)
GBP/USD hits the psychological zone of 1.4500
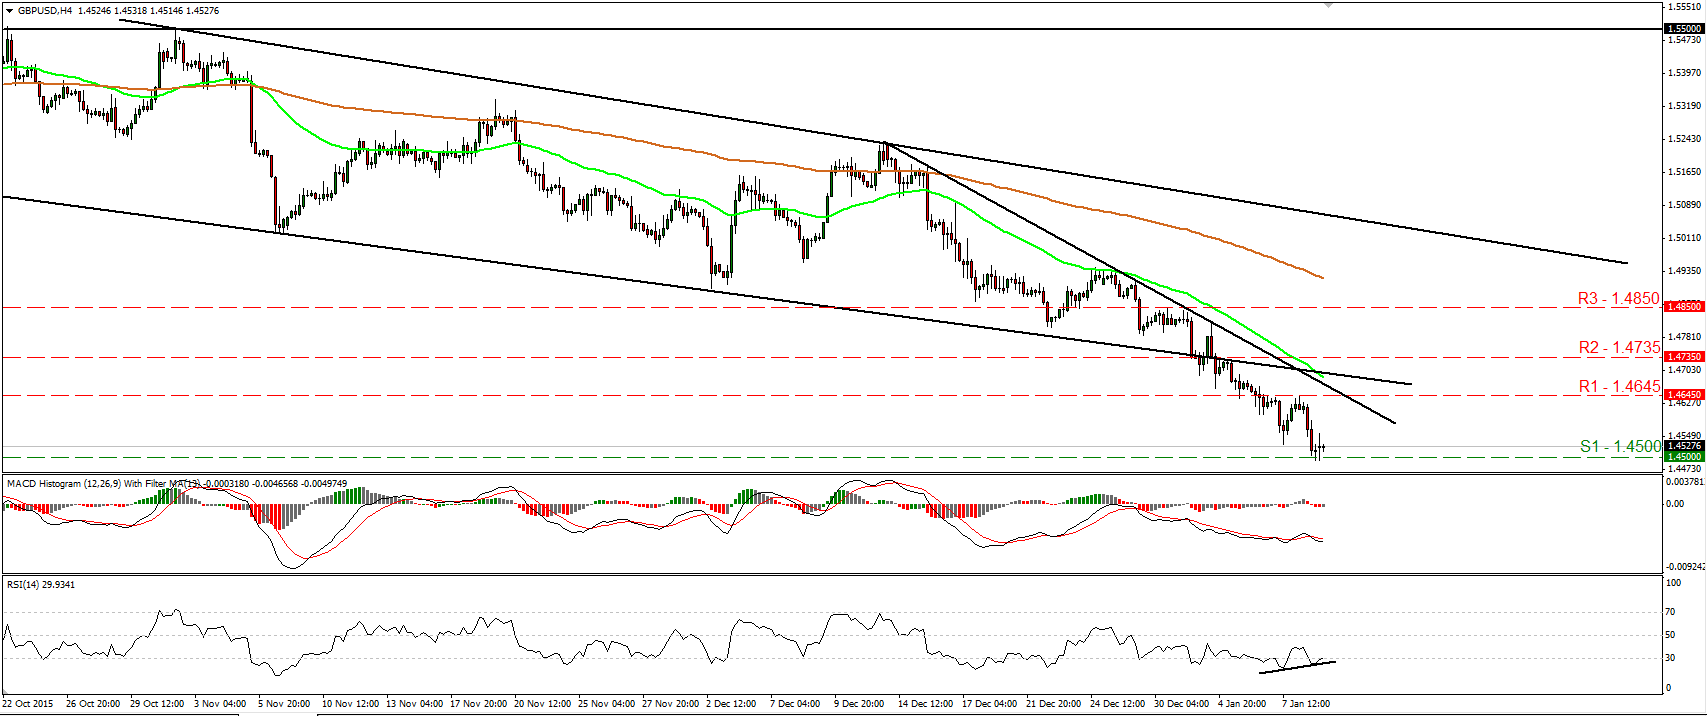
• GBP/USD continued trading lower on Friday and managed to reach the psychological territory of 1.4500 (S1). The rate is still trading below the downtrend line taken from the peak of the 14th of December and thus I still consider the short-term picture to be negative. A clear break below 1.4500 (S1) is likely to signal the continuation of that trend and perhaps see scope for extensions towards the 1.4400 (S2) zone. Nonetheless, taking a look at our oscillators, I would be careful of a possible upside corrective move before the next bearish leg. The RSI looks ready to exit again its oversold zone, while the MACD, although negative, shows signs of bottoming. In the bigger picture, the price structure remains lower peaks and lower troughs below the 80-day exponential moving average, which is pointing down. Thus, I still see a negative longer-term picture. Nevertheless, I would get more confident on that down path if I see a clear close below the 1.4500 (S1) zone, which acted as a strong support territory back in mid-April.
• Support: 1.4500 (S1), 1.4400 (S2), 1.4350 (S3)
• Resistance: 1.4645 (R1), 1.4735 (R2), 1.4850 (R3)
USD/JPY keeps falling
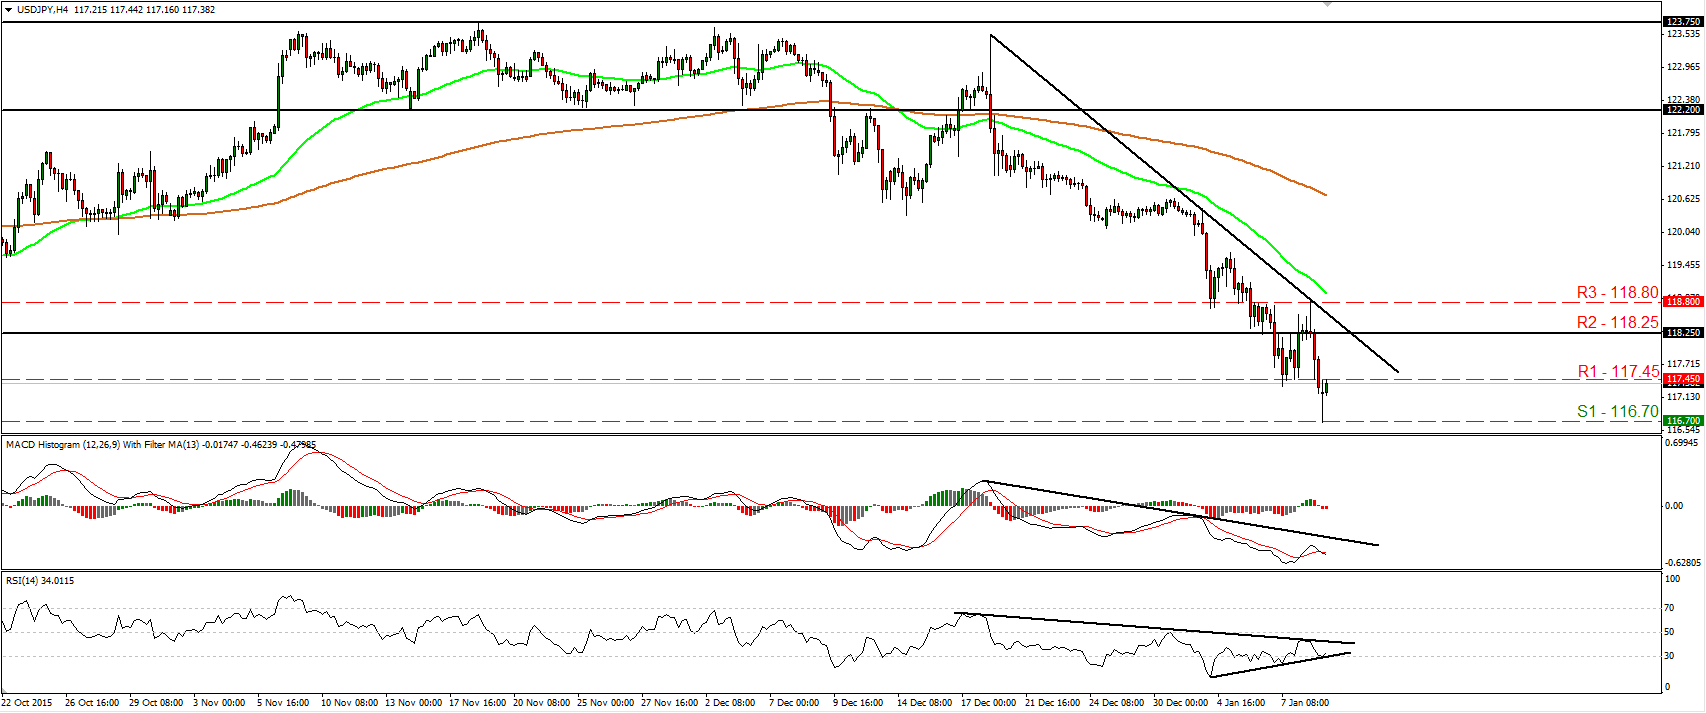
• USD/JPY tumbled on Friday after it hit resistance at the 118.80 (R3) barrier and the downtrend line taken form the peak of the 18th of December. The rate fell back below the key support (now turned into resistance) zone of 118.25 (R2) and found support at 116.70 (S1). Then, it rebounded and is currently trading near the resistance of 117.45 (R1). I would expect the bears to regain their momentum at some point and aim for another test at 116.70 (S1). A clear dip below 116.70 (S1) is likely to open the way for the next support zone at 116.00 (S2). Our short-term oscillators detect negative momentum and support the near-term negative outlook. However, there is positive divergence between the RSI and the price action, something that makes me believe that a corrective bounce could be in the works before the next negative leg. As for the broader trend, I still believe that the break below the key zone of 118.25 (R2) raises some concerns for a longer-term trend reversal.
• Support: 116.70 (S1), 116.00 (S2), 115.50 (S3)
• Resistance: 117.45 (R1), 118.25 (R2), 118.80 (R3)
Gold aims for another test near 1110
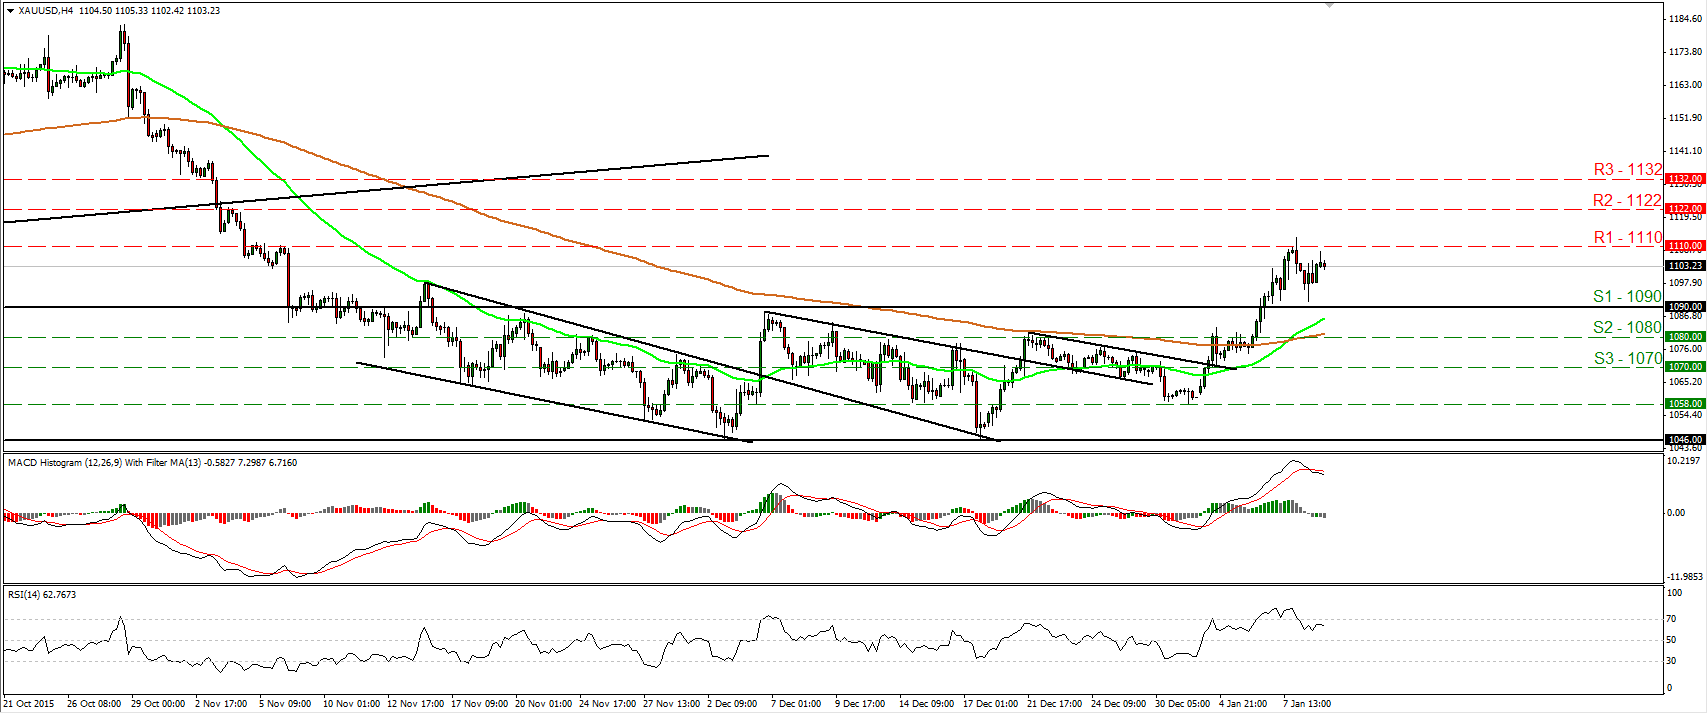
• Gold traded higher on Friday after it hit support fractionally above the 1090 (S1) support barrier. The price structure on the 4-hour chart still suggests a short-term uptrend and as a result, I would expect the break above the 1110 (R1) resistance territory to set the stage for extensions towards the next obstacle at 1122 (R2). Nevertheless, our short-term oscillators provide evidence that another setback could be looming before the next positive leg. The RSI fell back below its 70 line, while he MACD has topped and fallen below its trigger line. As for the broader trend, the move above 1090 (S1) signaled the upside exit of the sideways range the precious metal had been trading between that zone and the support area of 1046. Therefore. I believe that medium-term picture has turned somewhat positive as well.
• Support: 1090 (S1), 1080 (S2), 1070 (S3)
• Resistance: 1110 (R1), 1122 (R2), 1132 (R3)
WTI continues to collapse
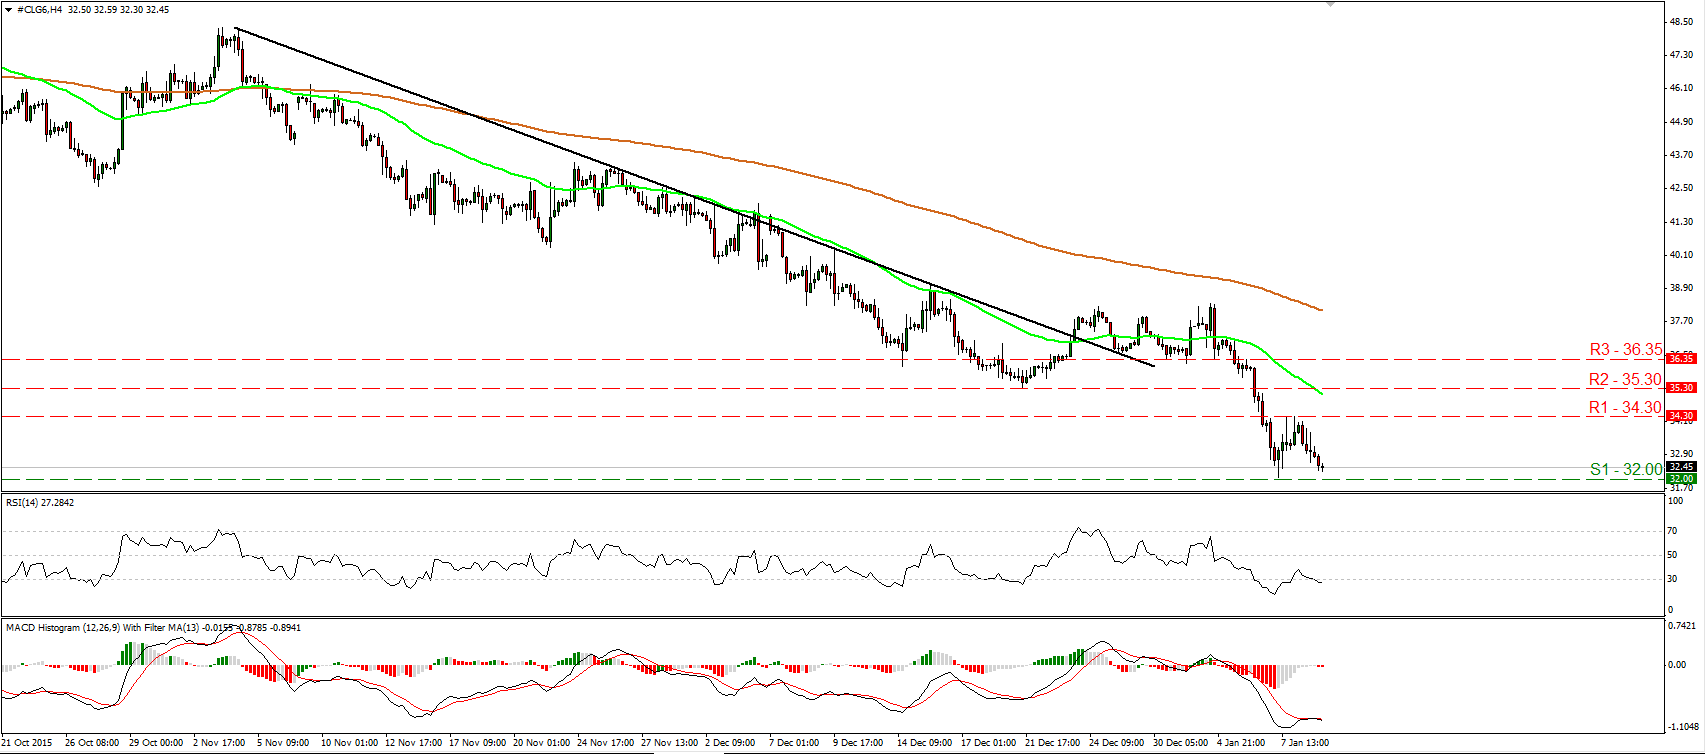
• WTI tumbled again on Friday after it hit resistance at 34.30 (R1). During the early European morning Monday, the price is headed for another test at 32.00 (S1), Thursday’s low, where a clear dip is likely to aim for the 31.00 (S2) zone. The short-term picture looks as negative as it can get and this is also supported by our short-term oscillators. The RSI is back below its 30 line and is pointing down, while the MACD, already at extreme low levels, turned down and fell back below its trigger line. On the daily chart, I see that WTI has been printing lower peaks and lower troughs since the 9th of October. As a result, I would consider the longer-term picture to stay negative as well.
• Support: 32.00 (S1), 31.00 (S2), 30.00 (S3)
• Resistance: 34.30 (R1), 35.30 (R2), 36.35 (R3)

