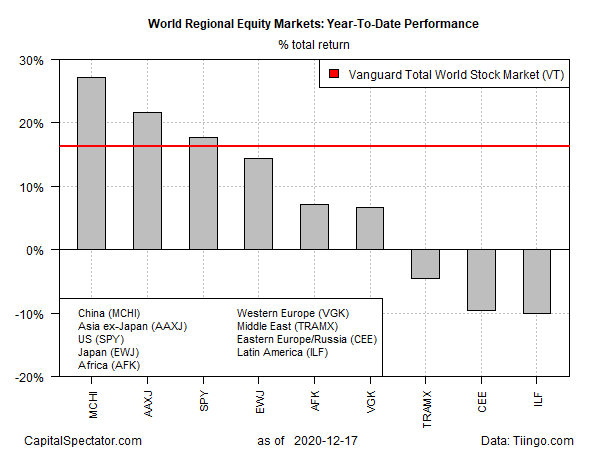
China’s stock market is posting the strongest gain among the world’s main equity regions in 2020 as the year’s final trading sessions come into view, based on a set of publicly traded proxies through yesterday’s close (Dec. 17).
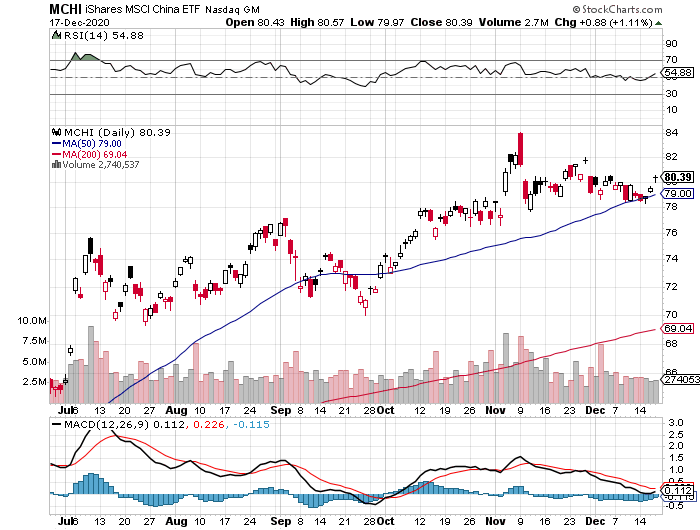
The iShares MSCI China ETF (NASDAQ:MCHI) is up 26.9% on a total return basis year to date. After bouncing off its 50-day average this week, the fund was close to a record high at the end of Thursday’s session.

Chinese equities face the risk of renewed selling pressure in the short term in the wake of a renewed push by the US to ban some of the country’s shares from purchases by American investors. As a result, several index providers—including MSCI, S&P Dow Jones and FTSE Russell – said they would remove several Chinese firms from their global benchmarks.
For now, however, MCHI’s bullish moment still looks strong. For the year so far, the ETF is well ahead of the rest of the field.
US stocks, for instance, are up 17.4% in 2020, based on SPDR S&P 500 (NYSE:SPY). That’s a strong gain but no match for MCHI’s year-to-date rally.
The global benchmark for shares is up 15.9% this year, based on Vanguard Total World Stock Index Fund ETF Shares (NYSE:VT).

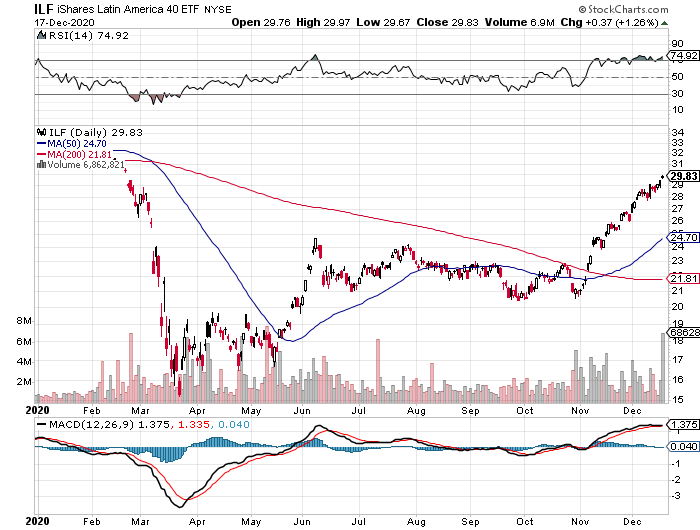
The weakest year-to-date performer: iShares Latin America 40 ETF (NYSE:ILF). The ETF has lost 10% in 2020. But the fund’s steep decline started to look like an opportunistic bargain in November. The tailwind of a falling US Dollar, which boosts prices non-dollar assets after conversion into greenbacks, combined to lift ILF sharply in recent weeks. Since ILF’s previous low on Oct. 30, the fund is up more than 40% through yesterday’s close (Dec. 17) and is now at the highest level since the coronavirus crash in March.

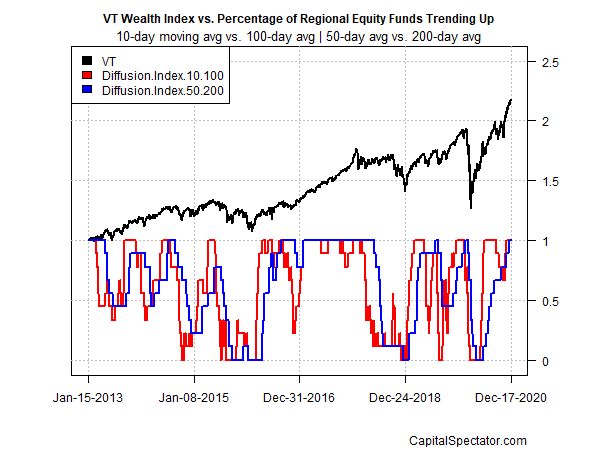
Bullish momentum prevails for all the funds listed above, based on two sets of moving averages. For short-term momentum (10-day vs. 100-day moving averages) it’s a clean sweep of upside biases at the moment. Ditto for medium-term momentum (50-day vs. 200-day averages). Optimism in the extreme reigns supreme as 2020’s end game approaches for global trading throughout the world’s equity markets.

Which stock should you buy in your very next trade?
With valuations skyrocketing in 2024, many investors are uneasy putting more money into stocks. Unsure where to invest next? Get access to our proven portfolios and discover high-potential opportunities.
In 2024 alone, ProPicks AI identified 2 stocks that surged over 150%, 4 additional stocks that leaped over 30%, and 3 more that climbed over 25%. That's an impressive track record.
With portfolios tailored for Dow stocks, S&P stocks, Tech stocks, and Mid Cap stocks, you can explore various wealth-building strategies.

