London Forex Report: China growth data overnight demonstrated 2015 growth slowest since 1990, Q4 growth slowest since Q1 2009 due to the slowdown in property and stock markets negatively impacting growth. Oil slumped below $28 per barrel yesterday after sanctions on Iran was lifted, pushing stocks prices further south amid continuous sell off in the equity markets. USD Index gradually inched higher to close at 99.11, up 0.16%.
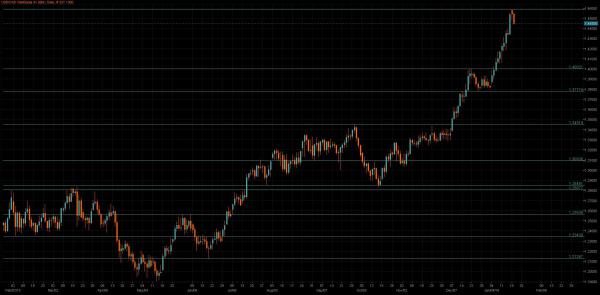
EUR/USD
Outlook: Short Term (1-3 Days): Bearish – Medium Term (1-3 Weeks): Bearish
Fundamental: EUR dropped from 1.0916 at the start of Asian session to around 1.0890 at NY market close. EUR/USD has been trading in the range of 1.0800 to 1.0980 for more than two weeks. Markets are waiting for the ECB meeting due this Thursday although the ECB is not likely to take action for additional easing in this week’s meeting. However, the non-stop drop of oil price has put pressure on the Eurozone inflation and the press conference will be closely watched.
Technical: While offers at 1.0950 contain upside reactions, expect rotation to retest bids at 1.08, a breach of 1.0990 trend resistance opens a broader 1.1240 symmetry corrective objective.
Interbank Flows: Bids 1.08 stops below. Offers 1.0950 Stops above.
Retail Sentiment: Neutral
Trading Take-away: Sidelines
GBP/USD
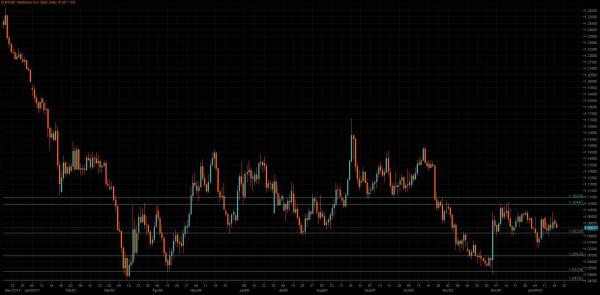
Outlook: Short Term (1-3 Days): Bearish – Medium Term (1-3 Weeks): Bearish
Fundamental: GBP struggled to recover from a five and a half year low, with markets finding few reasons to buy the currency while risks, such as a possible “Brexit” from Europe, sliding oil prices and a weak economic outlook continue to weigh. Inflation date and a speech by BoE Governor Carney will be eyed today.
Technical: While 1.4370 caps upside reactions, expect a grind lower to test bids at 1.42. Only over 1.45 eases immediate downside pressure.
Interbank Flows: Bids 1.42 stops below. Offers 1.44 stops above
Retail Sentiment: Bullish
Trading Take-away: Sell pullbacks to 1.4370 leaning against 1.45 to target 1.35
USD/JPY
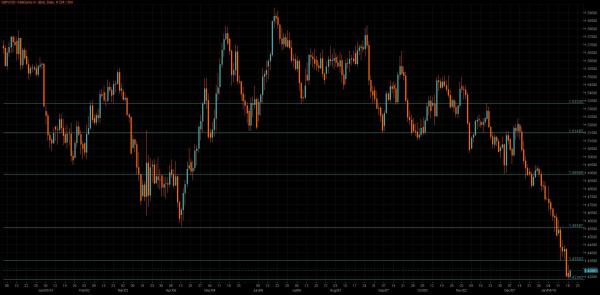
Outlook: Short Term (1-3 Days): Bearish – Medium Term (1-3 Weeks): Bearish
Fundamental: USD/JPY surged from 116.88 to high of 117.44 as equity markets stabilized overnight; it further climbed above 117.60 handle in early Tuesday session. The yen was traded in tandem with euro in the past few weeks as they are both regarded as risk-off currencies.
Technical: While 118.30 caps upside attempts, expect a retest of 117.30 from above. Only above 119 eases immediate downside pressure.
Interbank Flows: Bids 117 stops below. Offers 118 stops above
Retail Sentiment: Bullish
Trading Take-away: Sidelines
EUR/JPY
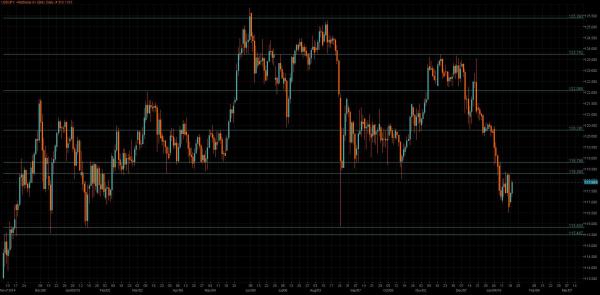
Outlook: Short Term (1-3 Days): Bearish – Medium Term (1-3 Weeks): Bearish
Fundamental: Japan’s manufacturing and services sectors contracted in Nov, proving that the rebound in Oct was short lived. Japan Economy Minister Amari commented overnight that although stocks were down on external factors, economic fundamentals solid, excessive oil price falls leading some producers to sell Japanese assets.
Technical: While 128.30 caps upside reactions, expect a grind lower to retest lows at 126.70s. A failure here opens a test of bids at 126. Only over 129 eases immediate downside pressure.
Interbank Flows: Bids 126.50 stops below. Offers 128.50 stops above
Retail Sentiment: Bullish to neutral
Trading Take-away: Sidelines
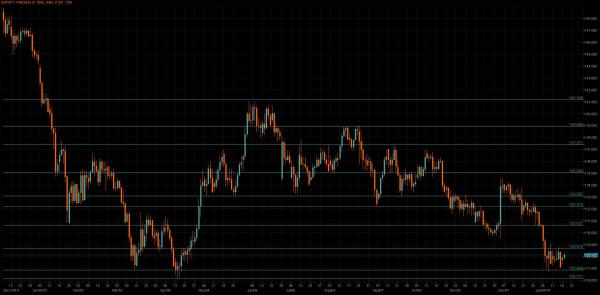
AUD/USD
Outlook: Short Term (1-3 Days): Bearish – Medium Term (1-3 Weeks): Bearish
Fundamental: AUD edged up nearly half a cent to 0.6927, underpinned by some bargain hunting after it touched a seven-year low. A minor recovery in iron ore, Australia’s top export earner, to above $40 a tonne supported the Aussie. The mineral has shed 40 percent in the past 12 months and dropped to $37 in December 2015, the lowest recorded by The Steel Index (TSI) which began in 2008.
Technical: While .6950 caps intraday upside expect a grind lower to retest .6830’s lows. Only a breach of .7050 eases immediate downside pressure.
Interbank Flows: Bids .6800 stops below. Offers .6950 stops above
Retail Sentiment: Bullish
Trading Take-away: Sell pullbacks to .6950 against .7050 to target .6750 initially
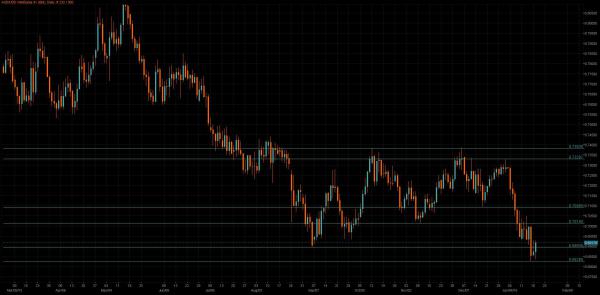
USD/CAD
Outlook: Short Term (1-3 Days): Bullish – Medium Term (1-3 Weeks): Bullish
Fundamental: CAD weakened against the USD as crude oil prices remained fragile and the investors braced for a potential Bank of Canada rate cut tomorrow, but losses were trimmed after hitting a fresh 12-year low overnight. Oil prices slumped to a 2003 low below $28 per barrel as the markets anticipated an upsurge in Iranian exports after the lifting of sanctions against Tehran over the weekend.
Technical: Bulls have the ball while 1.4385 supports, expect a grind higher to test stops above 1.46. Only below 1.42 eases immediate bullish pressure
Interbank Flows: Bids 1.4350 stops below. Offers 1.4550 stops above
Retail Sentiment: Bearish
Trading Take-away: Sidelines
