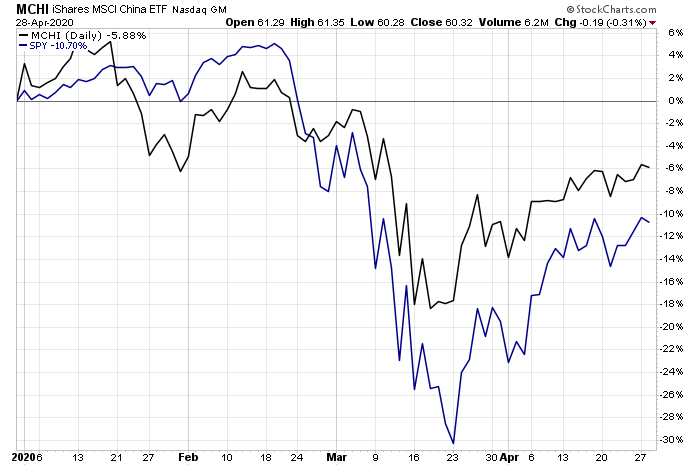
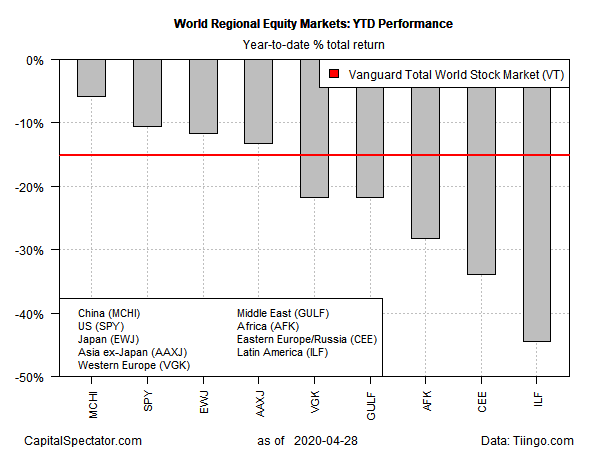
Losses still dominate year-to-date results for all the main regional slices of global stock markets, but China is holding on to it leadership position by posting a modest decline, based on a set of exchange traded funds through Apr. 28.
The iShares MSCI China ETF (NASDAQ:MCHI) is down 5.9% in 2020 through yesterday’s close, the softest setback vs. the rest of field. US equities are playing catch-up and are now in second-place with a 10.7% decline so far this year, based on SPDR S&P 500 (NYSE:SPY). That’s a step up for SPY, which was in fourth place in early April for the regional 2020 ranking.

A key reason for China’s leadership in equities: reports that the country’s economy is rebounding from the coronavirus fallout. “China appears to have moved past the worst of the coronavirus outbreak, and economic activity is bouncing back,” writes Qian Wang, Vanguard Investment Strategy Group’s managing director and chief economist, Asia-Pacific.
Talk of reopening economies in the developed world inspires bullish expectations elsewhere, too, but Qian Wang cautions that the outlook ex-China is mixed and still evolving. “Extrapolating outlooks for developed economies from China’s experience is unlikely to reveal a true picture, however. The economic structures are simply too different, and I believe the pace of recovery will thus differ significantly.”
For global stocks overall, shares are down 15.2% year to date, based on Vanguard Total World Stock (NYSE:VT). But the rally in recent weeks has pared what had been a 32% tumble for VT in 2020 as recently as Mar. 23.

Latin America continues to suffer the worst regional performance this year. The iShares Latin America 40 ETF (NYSE:ILF) is deep in the hole with a 44.4% decline so far in 2020. In contrast with most other regions, the recent upswing in global shares has bypassed ILF, which has continued to sink in recent weeks.
The main question for equity investors now: Is the recent rebound in many corners of global equities a bear market rally or the start of a new rebound that eventually recovers this year’s lost ground and leads to new highs? It’s fair to say that the jury’s still out.
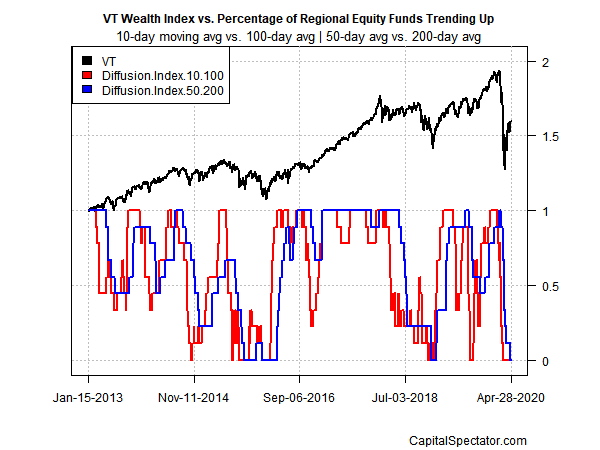
Consider, for example, a profile of momentum for the ETFs listed above, based on two sets of moving averages. The first measure compares the 10-day average with its 100-day counterpart — a proxy for short-term trending behavior (red line in chart below). A second set of moving averages (50 and 200 days) represent an intermediate measure of the trend (blue line). Using data through yesterday’s close reminds that markets have yet to post a strong degree of upside bias. Although the recent rally has repaired some of the damage, it’s not yet obvious that bullish momentum has fully regained its footing.

