It is easy to start blaming poor economic conditions for the poor jobs growth. But what if the poor economic conditions were caused by poor jobs growth?
Consider that the widely used tool of GDP as the economic metric is misleading pundits on economic dynamics. Bean counters always have problems with cause-and-effect as they cannot visualize dynamics and must calculate it based on what they understand – money flows.
Most employment models are based on monetary metrics (such as GDP based Okun’s Law) to forecast jobs growth – employment is considered a lagging indicator of the economy.
If one stares at the relationship between GDP and employment, GDP leads employment – and this is “proof” that employment is a byproduct of GDP.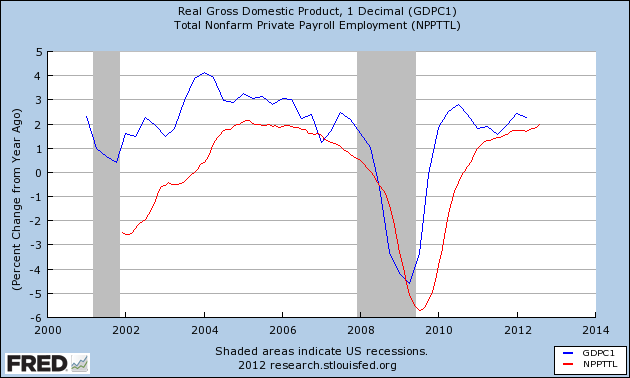
But GDP is not a measure of Main Street – and consumerism is over 2/3rds of the economy. Since GDP is essentially equal to GDI (gross domestic income), and 2/3 is related to consumption, how can it be that GDP can lead employment? That is a question I will leave on the table.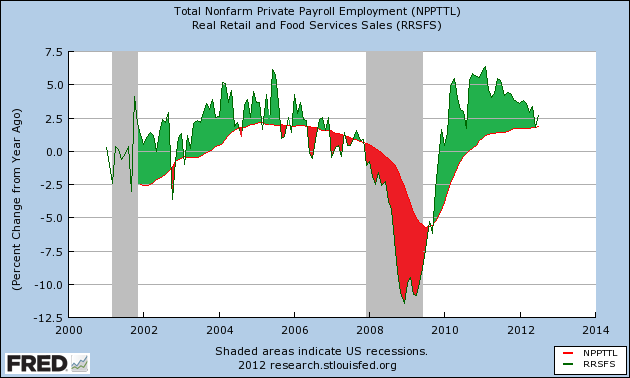
It is likely the relationship between retail sales and employment is the tattle-tail for the economy. When retail sales growth drops below employment growth, the economy is on an economic warning path. The red areas under the employment growth curve are economic contraction warnings, while the green areas above the employment growth curve are period of economic expansion.
One might notice that in June 2012 – the growth rate of employment and retail sales came close to inverting.
It is not too far of a stretch, once one realizes employment is part of the economic dynamic (and not a byproduct) – to state that employment growth is a (major) factor which causes economic growth – and it has been a very good determinate historically of an oncoming recession. The graph below shows when population adjusted employment growth falls below the zero year-over-year growth line, a recession is imminent.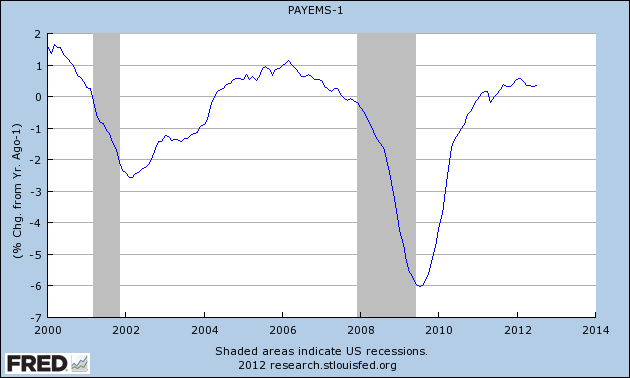
If employment is a driver for GDP (and not a byproduct), what is causing the poor jobs growth is the question. The reason is that new business starts are nowhere near pre-Great Recession levels. Small business is the engine for employment growth.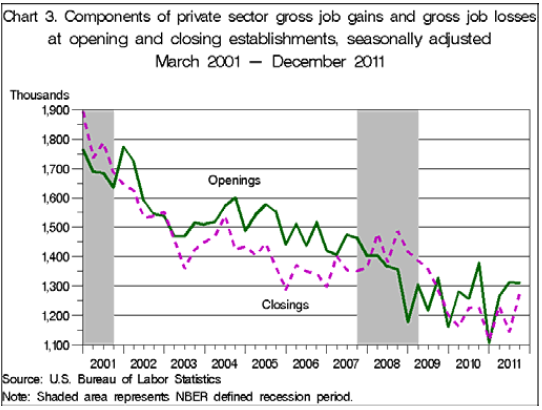
The chart above is from the BLS’s BUSINESS EMPLOYMENT DYNAMICS – FOURTH QUARTER 2011. It shows that new business is not being formed at past rates. I have continually stated that employment dynamics changed around 2000 – and likely is the reason for slow economic recovery for recent recessions.
If I were to guess at the cause of reduced business starts, it is the barriers to creation of a new business:
- permits – what permits do you need to open a lemonade stand, or a gas station, or a restaurant
- regulation – what is the plant requirements for the lemonade stand, or gas station, or restaurant
- administrative – the paperwork required for compliance including payroll.
Cause and effect is hard to determine when two elements seem to move in tandem – and one is blinded by believing the lead item (GDP) is determining employment.
Other Economic News this Week:
The Econintersect economic forecast for September 2012 shows moderate growth continuing. Overall, trend lines seem to be stable even with the fireworks in Europe, and poor data from China. An emotional component of my mind cannot help thinking this is the calm before the storm. But a logical component in the same cranium sees there are no recession flags showing in any of the indicators Econintersect follows which have been shown to be economically intuitive. There is no whiff of recession in the hard data – even though certain surveys are at recession levels.
ECRI stated in September 2011 a recession was coming . The size and depth is unknown. A positive result is this pronouncement has caused much debate in economic cyberspace. I will be glad when ECRI removes this warning (and hopefully not when the economy actually crosses into darkness). Yet, ECRI is still insisting a recession is here (from a 07Sep2012 post on their website):
Recession Evidence Obscured in Real Time
In recent weeks, several key coincident indicators have surprised the consensus to the upside, bolstering the belief that the U.S. economy has dodged recession. Even though the latest releases may show increases, earlier data have almost uniformly been revised downward, a reality largely ignored by many. For example, after revisions, there is a net gain of only 55,000 jobs in today’s payroll jobs report, which is itself subject to further revisions.
Amid these cross currents, ECRI has completed an in-depth study of after-the-fact revisions to coincident indicators, revealing that they themselves display distinct patterns around business cycle turning points.
With preliminary data often obscuring real-time evidence of recession, our analysis underscores the importance of having an array of robust leading indexes for real-time monitoring of the economy.
The ECRI WLI growth index value improved this week enjoying its second week in positive territory. The index is indicating the economy six months from today will be slightly better than it is today.

Initial unemployment claims declined from 374,000 (reported last week) to 365,000 this week. Historically, claims exceeding 400,000 per week usually occur when employment gains are less than the workforce growth, resulting in an increasing unemployment rate (background here and here). The real gauge – the 4 week moving average – rose slightly from 370.250 (reported last week) to 371,250. Because of the noise (week-to-week movements from abnormal events AND the backward revisions to previous weeks releases), the 4-week average remains the reliable gauge.
Weekly Initial Unemployment Claims – 4 Week Average – Seasonally Adjusted – 2010 (blue line), 2011 (red line), 2012 (green line)

Data released this week which contained economically intuitive components(forward looking) were
- Rail movements (where the economic intuitive components continue to be indicating a moderately expanding economy).
- Jobs Reports – Although good jobs reports historically have little correlation to the economy, bad ones foretell bad times. In this regard, this week’s reports are not foretelling bad times (or good times either).
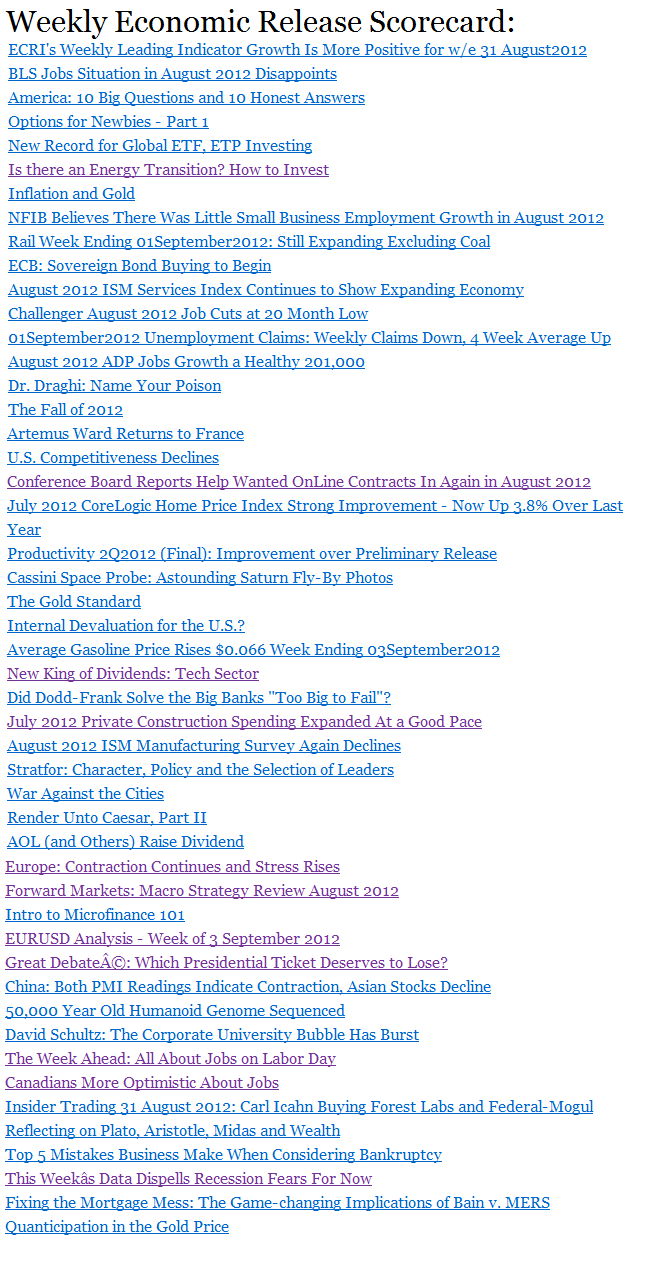
Weekly Economic Release Scorecard:
Click here to view the scorecard table below with active hyperlinks.
Bankruptcies this Week: Journal Register
