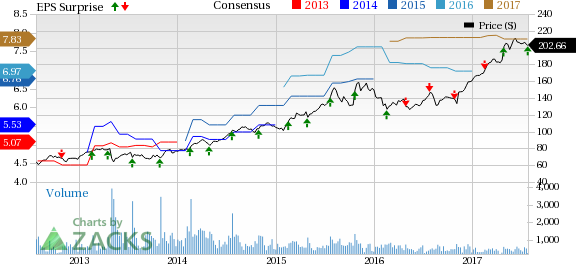
Chemed Corp.’s (NYSE:CHE) second-quarter 2017 adjusted earnings per share (EPS) (considering stock-based compensation expenses and related tax benefit as a regular one) were $2.19, as compared to the year-ago adjusted EPS figure of $1.71, up 28.1% year over year.
Including one-time items, the company reported second-quarter net loss of $1.35 per share, comparing unfavorably with earnings of $1.48 a year ago.
Quarter in Details
Revenues in the quarter increased 6.3% year over year to $415.1 million, beating the Zacks Consensus Estimate of $405.4 million.
Chemed currently operates through two wholly-owned subsidiaries, namely, VITAS Healthcare Corporation – a major provider of end-of-life care – and Roto-Rooter – a leading commercial and residential plumbing and drain cleaning services provider.
In the second quarter, net revenue at VITAS Healthcare totaled $284.7 million, reflecting an increase of 2.1% year over year. The quarter’s revenues were driven by a 1.7% increase in the average net Medicare reimbursement rate and a 2.8% rise in average daily census. However, this was offset by acuity mix shift which negatively impacted revenues by 2.5%.
Roto-Rooter reported sales of $130.3 million in the second quarter, up 16.7% year over year. According to the company, revenues from water restoration increased 72.1% year over year to $20.9 million.
Gross margin expanded 189 basis points (bps) year over year to 32.1%. Adjusted operating margin expanded 139 bps to 14.6% in the quarter on a 9.6% rise in selling, general and administrative expenses to $68.7 million.
Chemed exited the second quarter of 2017 with total cash and cash equivalents of $13.8 million, down from $47 million at the end of first-quarter 2017. The company had total debt of $125.0 million at the end of the second quarter, compared with $146.9 million at the end of the preceding quarter. As of Jun 30, 2017, the company had approximately $269 million in undrawn borrowing capacity under its existing five-year credit agreement.
During the second quarter, the company repurchased shares worth $30.8 million. In Mar 2017, the board had authorized an additional 100 million for Chemed’s existing share repurchase plan. As of Jun 30, 2017, the company had $65.1 million of remaining share repurchase authorization under the plan.
2017 Outlook
VITAS Healthcare revenue growth projection for 2017 was revised downward to the range of 2% to 3% prior to the Medicare Cap from the earlier range of 4% to 5%. Also, the admissions and Average Daily Census in 2017 is expected to increase 3% to 5% (earlier it was 3% to 4%). Medicare Cap billing limitations are expected at around $2.5 million in 2017, while it was around $3.7 million earlier.
The Roto-Rooter business is estimated to grow 12% to 13% in the full year, as compared with the earlier provided range of 3% to 4%. The raised guidance was backed by a 2% increase in job pricing and water restoration services growth.
Full-year adjusted EPS is expected to grow in the range of $8.10 to $8.20 ($7.80 to $8.00 previously) as compared with $7.24 reported in 2016.
Our Take
Chemed’s better-than-expected revenue performance in the second quarter on the back of solid growth in its Roto-Rooter business buoys optimism. Also, we are encouraged to note that both of the company’s subsidiaries saw year-over-year revenue growth in the quarter. The strong bottom-line projection also raises hopes. However, the downward revision of the revenue growth guidance for VITAS Healthcare is a matter of concern.
Further, reimbursement-related issues, seasonality in business, a competitive landscape and dependence on government mandates continue to pose challenges to Chemed.
Zacks Rank & Key Picks
Chemed currently has a Zacks Rank #3 (Hold).A few better-ranked medical stocks are Mesa Laboratories, Inc. (NASDAQ:MLAB) , INSYS Therapeutics, Inc. (NASDAQ:INSY) and Align Technology, Inc. (NASDAQ:ALGN) . Notably, INSYS Therapeutics and Align Technology sport a Zacks Rank #1 (Strong Buy), while Mesa Laboratories carries a Zacks Rank #2 (Buy). You can see the complete list of today’s Zacks #1 Rank stocks here.
Align Technology has an expected long-term adjusted earnings growth of almost 24.1%. The stock has added roughly 35.7% over the last three months.
INSYS Therapeutics has a long-term expected earnings growth rate of 20%. The stock has gained around 4.3% over the last three months.
Mesa Laboratories has a positive earnings surprise of 2.84% for the last four quarters. The stock has added roughly 3.1% over the last three months.
The Hottest Tech Mega-Trend of All
Last year, it generated $8 billion in global revenues. By 2020, it's predicted to blast through the roof to $47 billion. Famed investor Mark Cuban says it will produce "the world's first trillionaires," but that should still leave plenty of money for regular investors who make the right trades early. See Zacks' 3 Best Stocks to Play This Trend >>
Mesa Laboratories, Inc. (MLAB): Free Stock Analysis Report
Insys Therapeutics, Inc. (INSY): Free Stock Analysis Report
Chemed Corp. (CHE): Free Stock Analysis Report
Align Technology, Inc. (ALGN): Free Stock Analysis Report
Original post
Zacks Investment Research

