Chelsea Therapeutics International, Ltd. is a development stage pharmaceutical company that focuses on acquiring, developing and commercializing products for the treatment of a variety of human diseases.
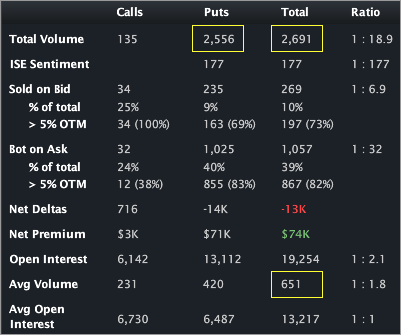
This is an order flow note -- in particular in the elevated downside Mar vol. The company has traded over 2,600 contracts on total daily average option volume of just 651. Puts have traded on a 19:1 ratio to calls with the action in the Mar 3 puts (~1,450 have traded today). The Stats Tab and Day's biggest trades snapshots are included (below).


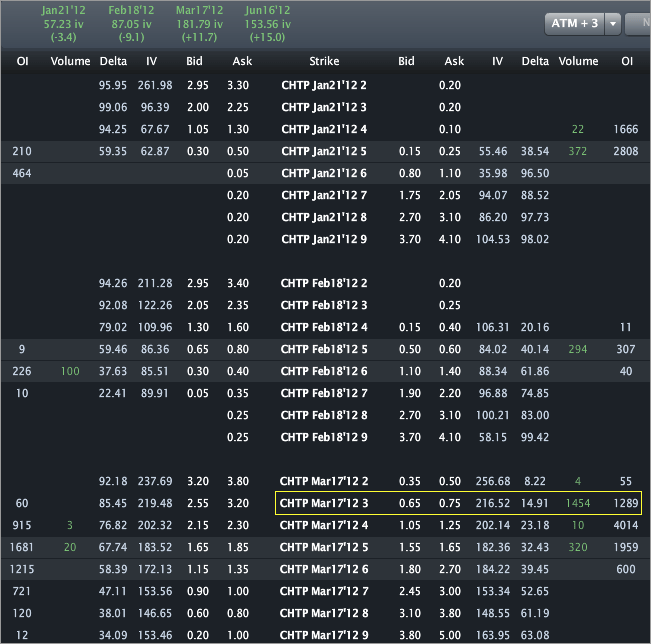
The Options Tab (below) illustrates that the puts have traded on an existing OI that's about the same size. Looking at the historical OI chart in Livevol® Pro, we can see the OI jumped today from 289 to 1,289. Easy math tells us that 1,000 opening contracts traded yesterday. Those look like purchases, and the puts today look like purchases again. This feels like a double down in opening downside puts.

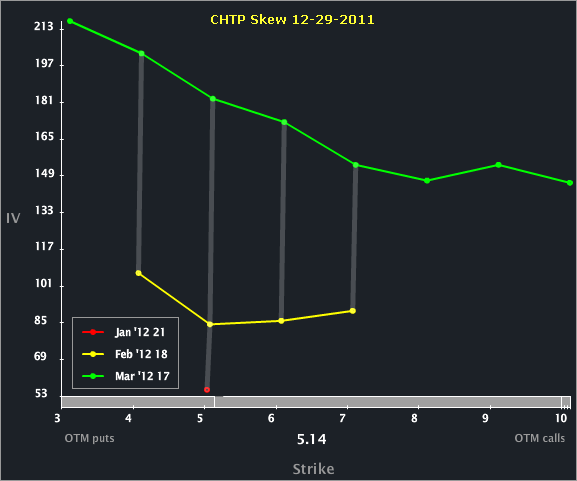
The Skew Tab snap (below) illustrates the vols by strike by month.

We can see a decided vol diff between the months -- specifically, Mar is elevated to the front two months. The option market reflects an event / news in the Mar cycle, but not in the Jan or Feb cycles. Cool... Looking to the Options Tab (above), we can see that Jan, Feb and Mar are priced to 57, 87 and 182 vol, respectively.
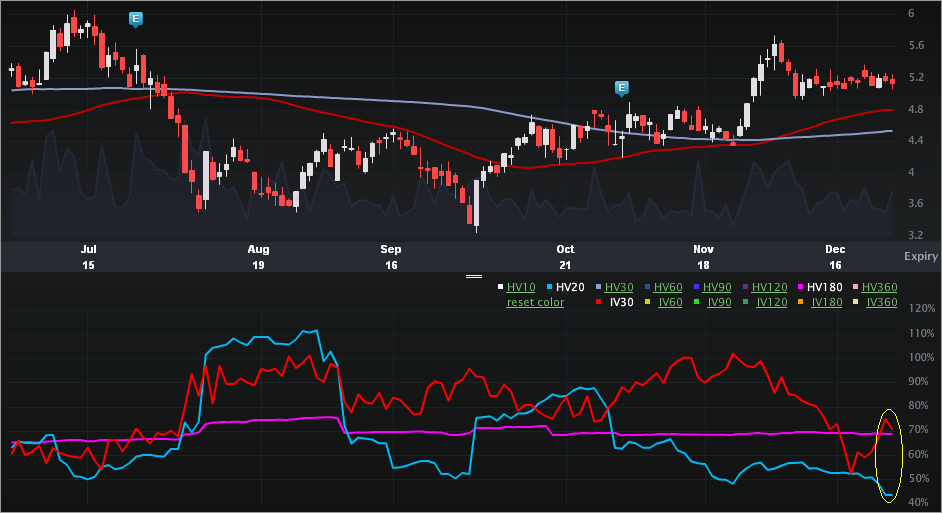
Finally, the Charts Tab (6 months) is below. The top portion is the stock price, the bottom is the vol (IV30™ - red vs HV20 - blue vs HV180 - pink).

The part of this chart that grabbed my attention was the tail end of the HV20. The stock has essentially stood still in the last month of trading. This is common when a "news" stock has an event due out in the relatively near future and investors / traders are basically waiting for that news. The stock finds an eerie calm until... it doesn't.
This is trade analysis, not a recommendation.
This is an order flow note -- in particular in the elevated downside Mar vol. The company has traded over 2,600 contracts on total daily average option volume of just 651. Puts have traded on a 19:1 ratio to calls with the action in the Mar 3 puts (~1,450 have traded today). The Stats Tab and Day's biggest trades snapshots are included (below).


The Options Tab (below) illustrates that the puts have traded on an existing OI that's about the same size. Looking at the historical OI chart in Livevol® Pro, we can see the OI jumped today from 289 to 1,289. Easy math tells us that 1,000 opening contracts traded yesterday. Those look like purchases, and the puts today look like purchases again. This feels like a double down in opening downside puts.

The Skew Tab snap (below) illustrates the vols by strike by month.

We can see a decided vol diff between the months -- specifically, Mar is elevated to the front two months. The option market reflects an event / news in the Mar cycle, but not in the Jan or Feb cycles. Cool... Looking to the Options Tab (above), we can see that Jan, Feb and Mar are priced to 57, 87 and 182 vol, respectively.
Finally, the Charts Tab (6 months) is below. The top portion is the stock price, the bottom is the vol (IV30™ - red vs HV20 - blue vs HV180 - pink).

The part of this chart that grabbed my attention was the tail end of the HV20. The stock has essentially stood still in the last month of trading. This is common when a "news" stock has an event due out in the relatively near future and investors / traders are basically waiting for that news. The stock finds an eerie calm until... it doesn't.
This is trade analysis, not a recommendation.
